Fig. 3.
Download original image
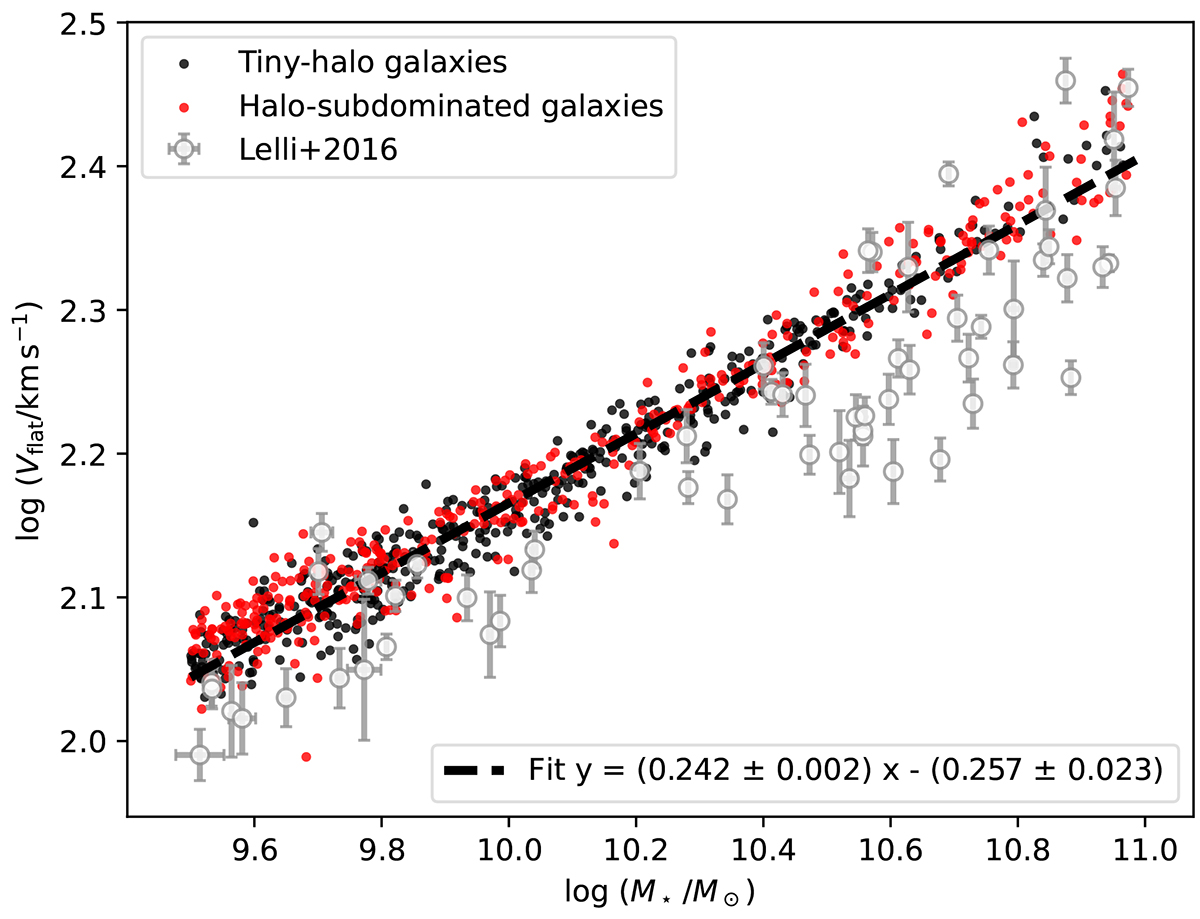
Tully–Fisher relation of galaxies in TNG (black and red dots) and observations. The vflat of TNG galaxies is measured by averaging the flat part (0.05 − 0.2 rvir) of the rotation curve. The observations are adopted from Lelli et al. (2016) assuming the mass-to-light ratio Γ = 0.5 M⊙/L⊙ based on the IMF suggested by Kroupa et al. (2001).
Current usage metrics show cumulative count of Article Views (full-text article views including HTML views, PDF and ePub downloads, according to the available data) and Abstracts Views on Vision4Press platform.
Data correspond to usage on the plateform after 2015. The current usage metrics is available 48-96 hours after online publication and is updated daily on week days.
Initial download of the metrics may take a while.