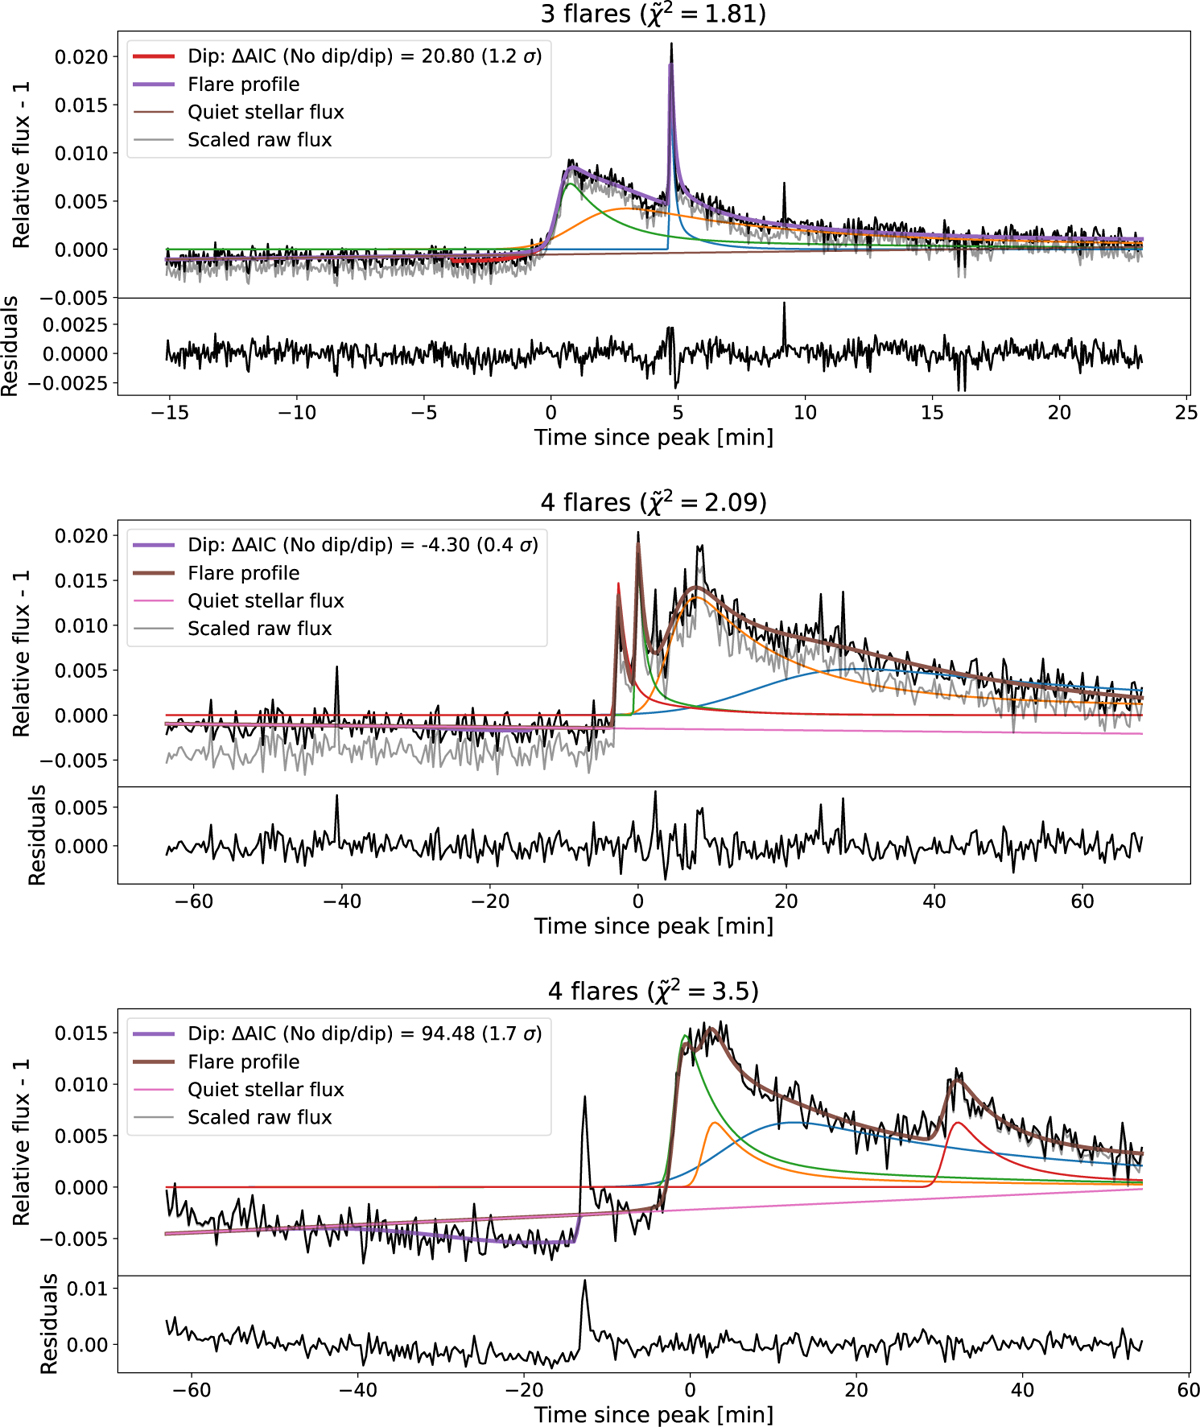
Fig. 7
Download original image
Examples of complex flare profiles. Top: a bump-peak flare profiles on V1054 Oph. Individual flare components are represented with different colours, and the total model (including the quiet stellar flux) is drawn with a thicker line. The grey, halftransparent line shows the raw flux before light curve detrending. The legend reports the AIC difference between a model without and with dip, and the fitted dip significance with respect to the correlated noise level. The rapid flux drops after min. 15 are likely not to be attributed to the stellar signal. Centre: a flare with structure in the rise phase observed on YZ Cmi. Bottom: a flattop profile flare on GJ 799B. Our fit strives to model it with a single profile and associates two flares to it. As we found such profiles to be rare, they do not significantly affect our complex flare statistics.
Current usage metrics show cumulative count of Article Views (full-text article views including HTML views, PDF and ePub downloads, according to the available data) and Abstracts Views on Vision4Press platform.
Data correspond to usage on the plateform after 2015. The current usage metrics is available 48-96 hours after online publication and is updated daily on week days.
Initial download of the metrics may take a while.