Fig. 16
Download original image
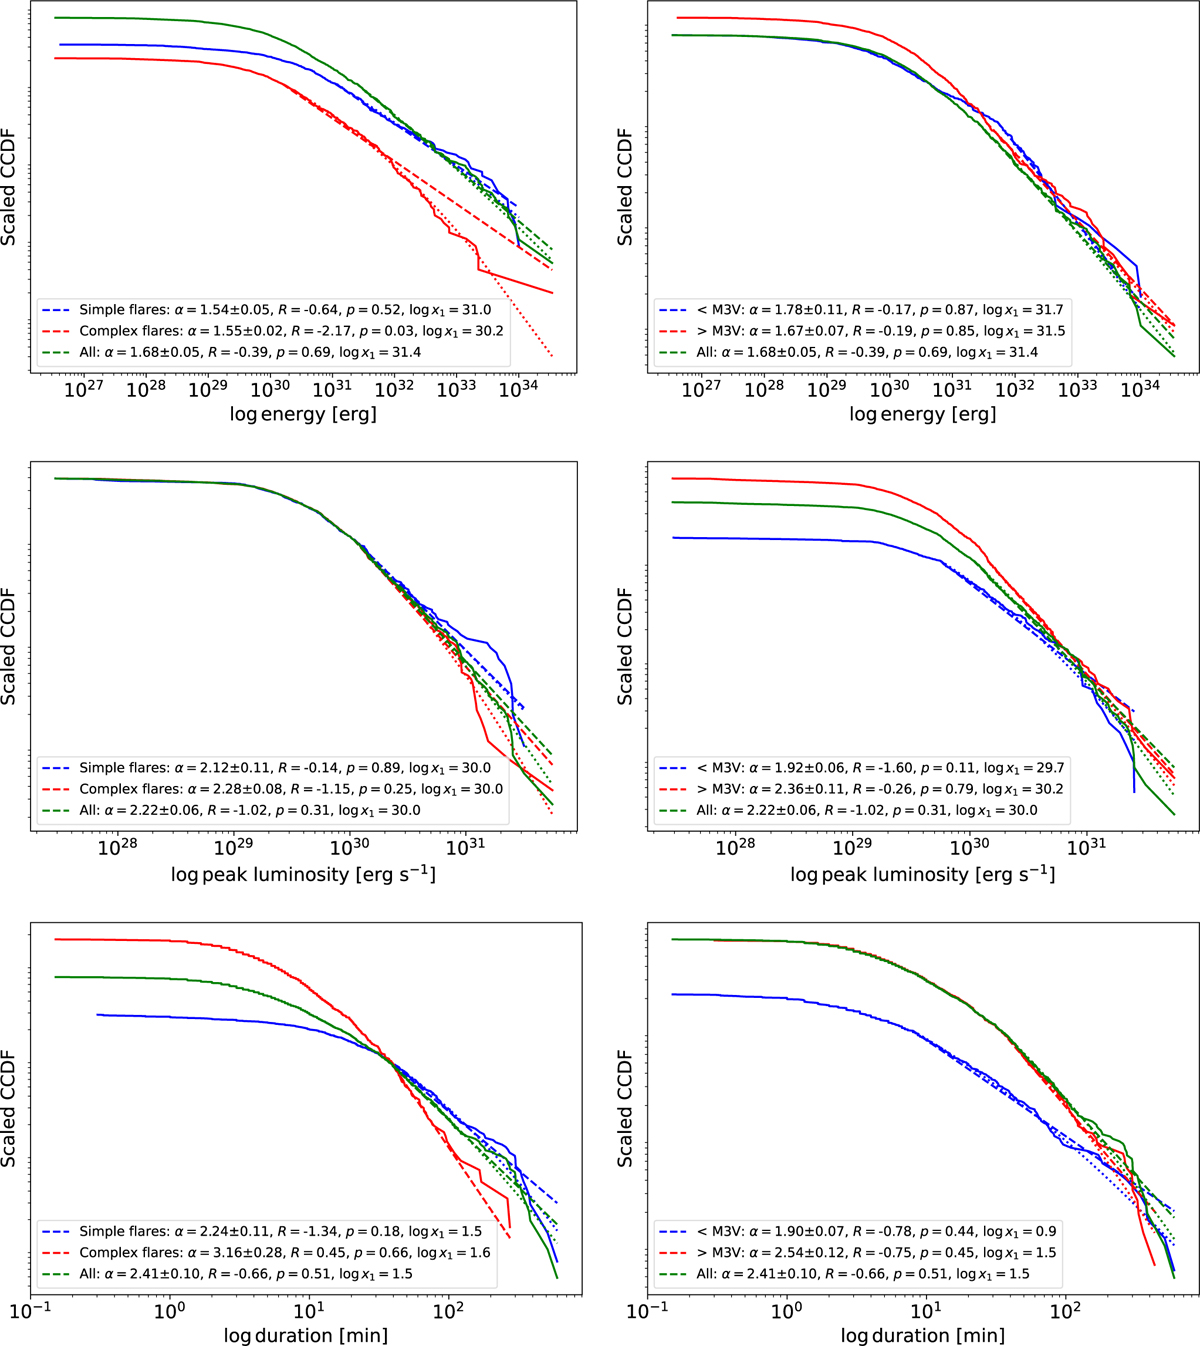
Complementary cumulative distribution functions (CCDFs) for flare parameters. Left column: scaled complementary cumulative distribution functions (CCDF) for flare energy (top), peak luminosity (centre) and duration (bottom), separated between simple flares (blue), complex flare components (red), and the full sample (green). Observed distributions, power-law fits, and log-normal distribution fits are represented with lines, dashed lines, and dotted lines, respectively. Right column: same as the left column, but where the flare sample is divided in events occurring on stars earlier (blue) or later (red) than M3V. In each panel, the legend indicates the fitted power-law coefficient α, the normalised likelihood ratio R between the power-law and log-normal fits, its associated p-value, and the lower bound of the inertial range used for the fit, x1.
Current usage metrics show cumulative count of Article Views (full-text article views including HTML views, PDF and ePub downloads, according to the available data) and Abstracts Views on Vision4Press platform.
Data correspond to usage on the plateform after 2015. The current usage metrics is available 48-96 hours after online publication and is updated daily on week days.
Initial download of the metrics may take a while.