Fig. 8
Download original image
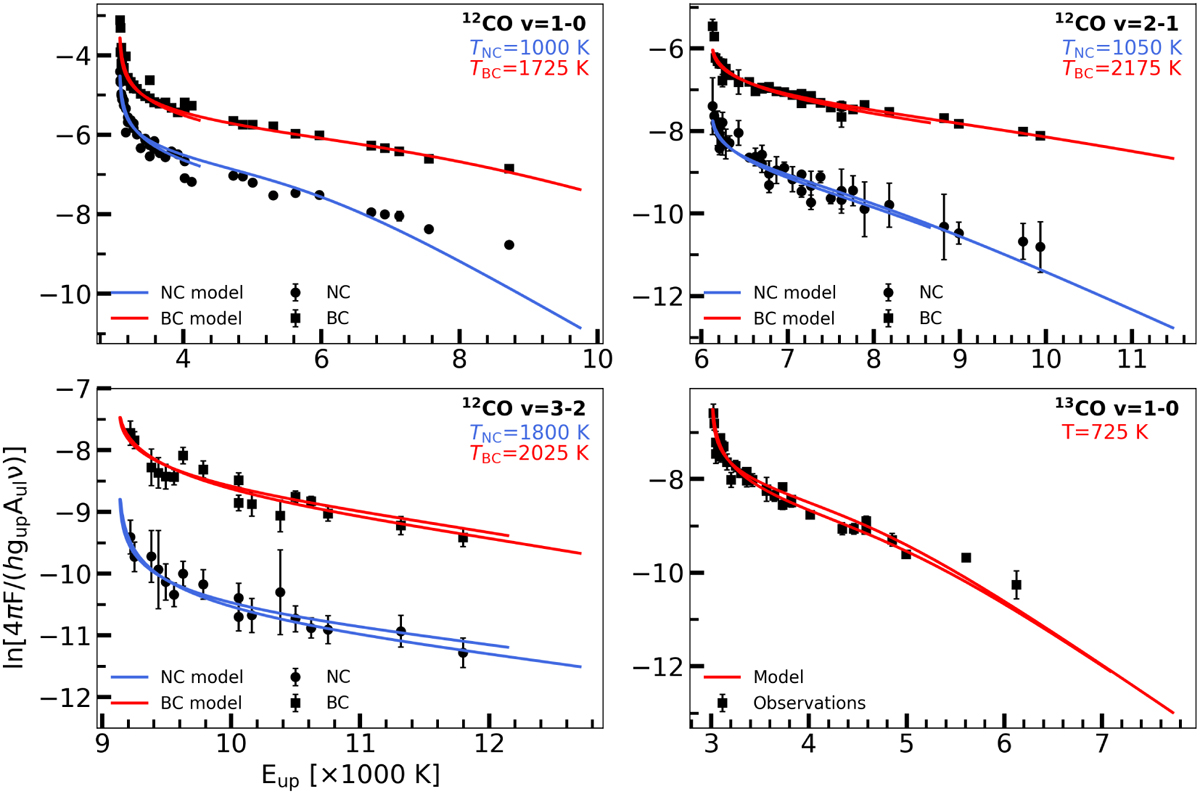
Rotational diagrams for 12CO υ = 1−0 (top left), υ = 2−1 (top right), υ = 3−2 (bottom left), and 13CO υ = 1−0 (bottom right). In each panel, the slab models are given by the solid line. For the 12CO transitions, the narrow and broad components (NC and BC, respectively) are shown separately. The integrated fluxes for the narrow component are given by the dots, while those for the broad component are indicated by the squares. The two lines in each model correspond the R- and P branches.
Current usage metrics show cumulative count of Article Views (full-text article views including HTML views, PDF and ePub downloads, according to the available data) and Abstracts Views on Vision4Press platform.
Data correspond to usage on the plateform after 2015. The current usage metrics is available 48-96 hours after online publication and is updated daily on week days.
Initial download of the metrics may take a while.