Fig. 7
Download original image
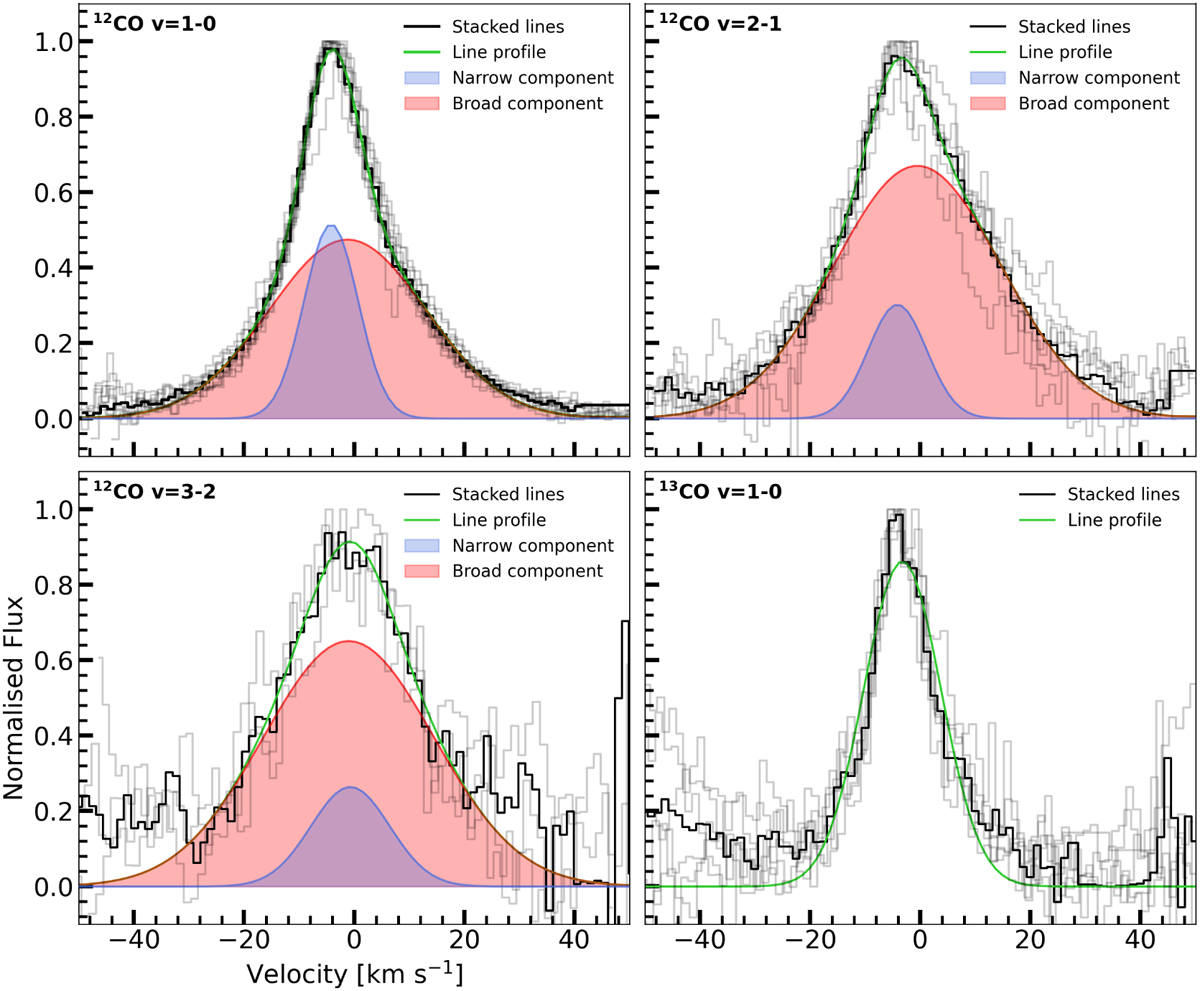
Fitted iSHELL line profiles for the CO υ = 1−0, υ = 2−1, υ = 3−2, and the CO υ = 1−0 transitions. The median line profile is shown in black, whereas the fitted line profile is shown in green. For the 12CO transitions, we have indicated the narrow and broad components in, respectively, blue and red. The faint, grey line profiles visible in the background correspond to the individual line profiles used in creating the weighted−averaged, normalised line profile.
Current usage metrics show cumulative count of Article Views (full-text article views including HTML views, PDF and ePub downloads, according to the available data) and Abstracts Views on Vision4Press platform.
Data correspond to usage on the plateform after 2015. The current usage metrics is available 48-96 hours after online publication and is updated daily on week days.
Initial download of the metrics may take a while.