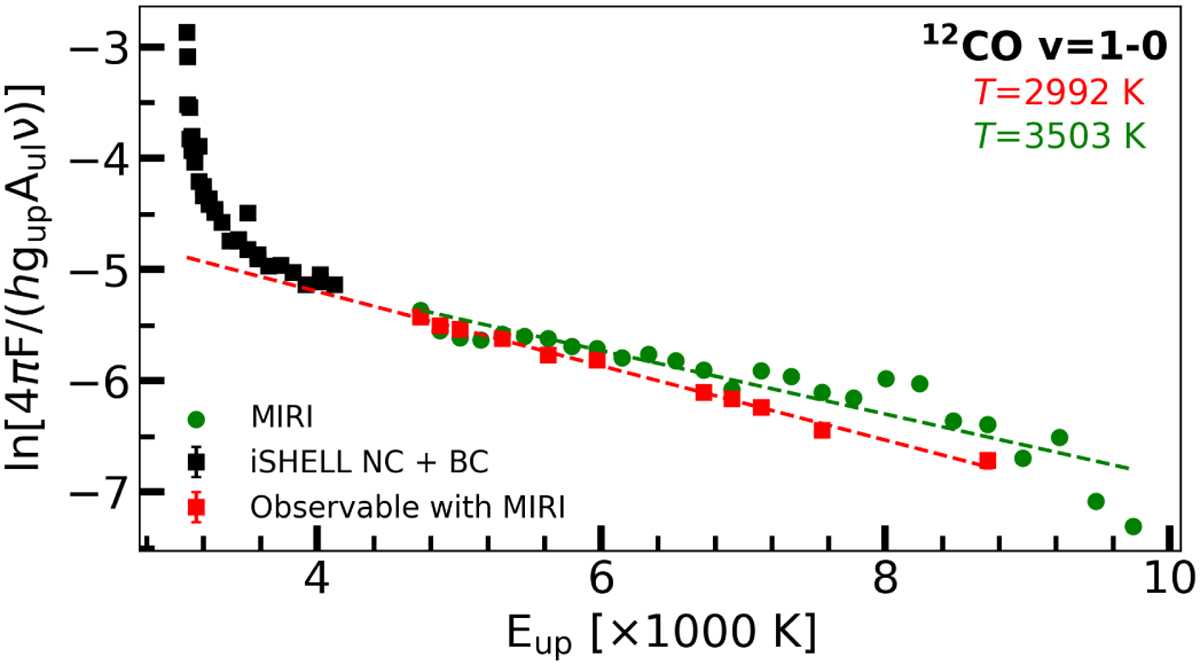
Fig. 6
Download original image
Rotational diagram of the 12CO υ = 1−0 transitions. As JWST-MIRI is unable to distinguish between the narrow (NC) and broad (BC) components, their contributions have been added together. The black squares indicate the fluxes inferred from the iSHELL observations, while the ones marked denote the transitions that are also observable with JWST-MIRI. Errorbars on the iSHELL observations are plotted, however, these are too small with respect to the size of the squares. The circles in green are the integrated fluxes inferred from the JWST-MIRI observations using a pseudo-Voigt profile. The red, dashed line is a fit to the red points, used to derive what excitation temperature JWST-MIRI would probe as seen with the iSHELL observations (T = 2992 ± 40 K). The green dashed line indicates the excitation temperature derived from these observations, ![]() .
.
Current usage metrics show cumulative count of Article Views (full-text article views including HTML views, PDF and ePub downloads, according to the available data) and Abstracts Views on Vision4Press platform.
Data correspond to usage on the plateform after 2015. The current usage metrics is available 48-96 hours after online publication and is updated daily on week days.
Initial download of the metrics may take a while.