Fig. 4
Download original image
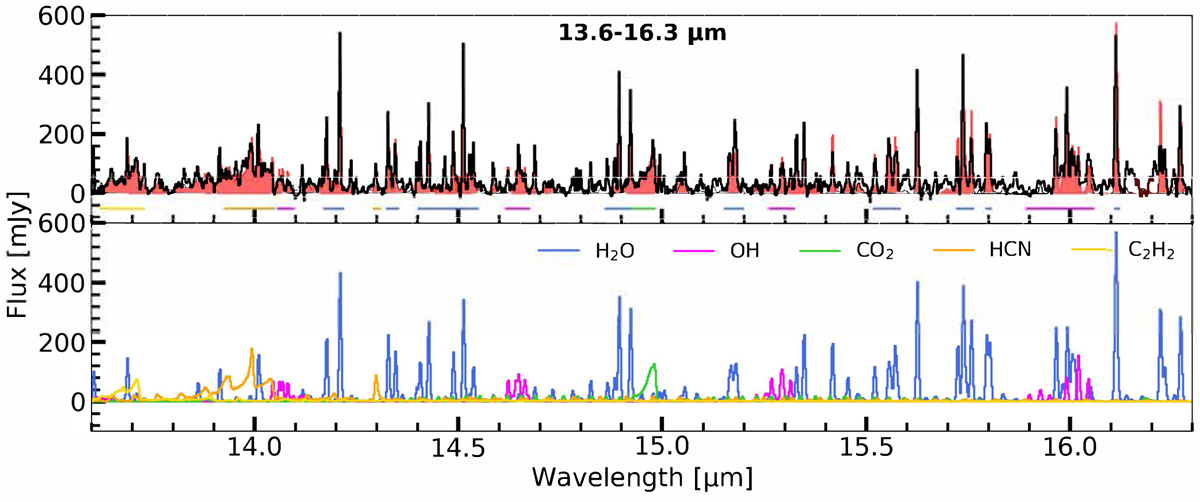
Best-fitting slab models of 12CO2, HCN, and C2H2 in the 13.6–16.3 µm wavelength region. The top panel displays the continuum subtracted JWST spectrum in a specific region, while the full model spectrum is shown in red. In addition, the horizontal bars show for each molecule the spectral windows used in the χ2 fits. The bottom panel shows the models for the individually detected molecules. The H2O and OH slab models are shown for completeness. Their model properties will be presented in Temmink et al. (in prep.)
Current usage metrics show cumulative count of Article Views (full-text article views including HTML views, PDF and ePub downloads, according to the available data) and Abstracts Views on Vision4Press platform.
Data correspond to usage on the plateform after 2015. The current usage metrics is available 48-96 hours after online publication and is updated daily on week days.
Initial download of the metrics may take a while.