Fig. 3
Download original image
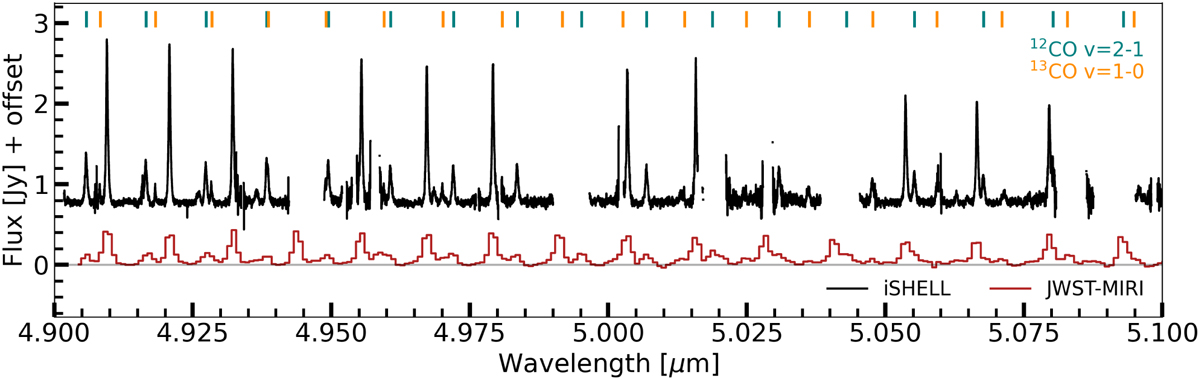
Comparison between the JWST-MIRI (red) and iSHELL (black) data within the wavelength region of 4.9–5.1 µm, to highlight the differences in flux and resolution. The iSHELL observations are offset by 0.75 Jy. The vertical lines at the top of the plot indicate the positions of the 12CO υ = 2−1 (teal) and 13CO υ = 1−0 (orange) transitions, to highlight the main contributors of the secondary CO emission peaks visible in this wavelength region.
Current usage metrics show cumulative count of Article Views (full-text article views including HTML views, PDF and ePub downloads, according to the available data) and Abstracts Views on Vision4Press platform.
Data correspond to usage on the plateform after 2015. The current usage metrics is available 48-96 hours after online publication and is updated daily on week days.
Initial download of the metrics may take a while.