Open Access
Fig. D.6
Download original image
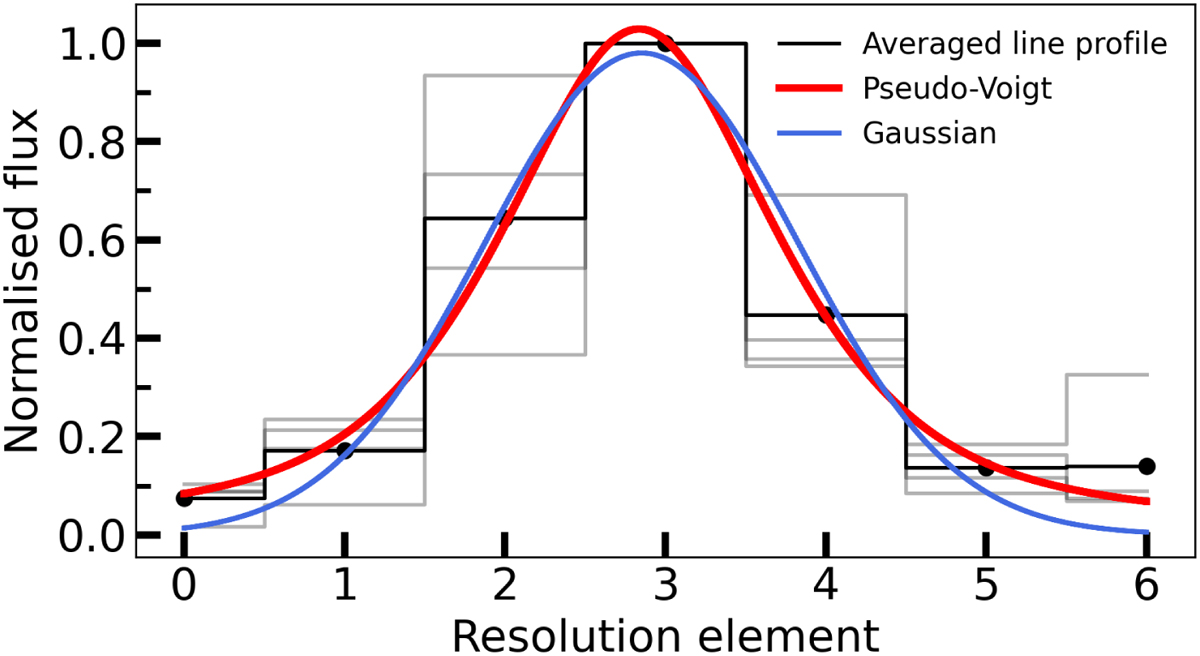
Averaged, normalised line profile of the four selected, unblended 12CO v=1-0 transitions observed with JWST-MIRI (see also Figure D.5. The faint grey lines indicate the individual, normalised lines, whereas the red and blue lines display, respectively, the fitted pseudo-Voigt and Gaussian profiles.
Current usage metrics show cumulative count of Article Views (full-text article views including HTML views, PDF and ePub downloads, according to the available data) and Abstracts Views on Vision4Press platform.
Data correspond to usage on the plateform after 2015. The current usage metrics is available 48-96 hours after online publication and is updated daily on week days.
Initial download of the metrics may take a while.