Fig. D.5
Download original image
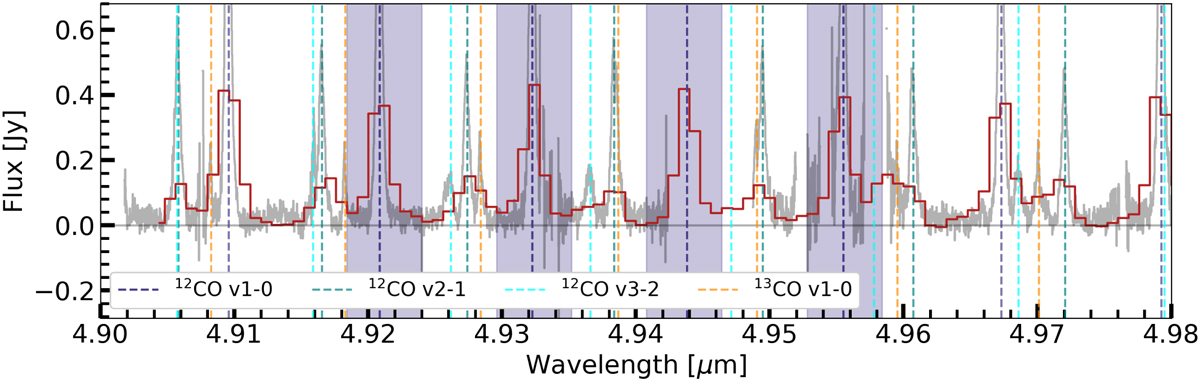
Xoom-in of Figure 3 on the JWST-MIRI data (red) within the wavelength region 4.90-4.98 µm. The iSHELL observations are shown here in grey. The different transitions in this wavelength region of the 12CO v=1-0 (dark blue), v=2-1 (teal), v=3-2 (cyan), and the 13CO v=1-0 (orange) transitions are shown to identify the different lines and highlight corresponding line overlaps. The dark blue shaded areas indicate the (relatively) isolated 12CO v=1-0 transitions that have been used to determine the pseudo-Voigt line profile of the JWST-MIRI data.
Current usage metrics show cumulative count of Article Views (full-text article views including HTML views, PDF and ePub downloads, according to the available data) and Abstracts Views on Vision4Press platform.
Data correspond to usage on the plateform after 2015. The current usage metrics is available 48-96 hours after online publication and is updated daily on week days.
Initial download of the metrics may take a while.