Fig. D.4
Download original image
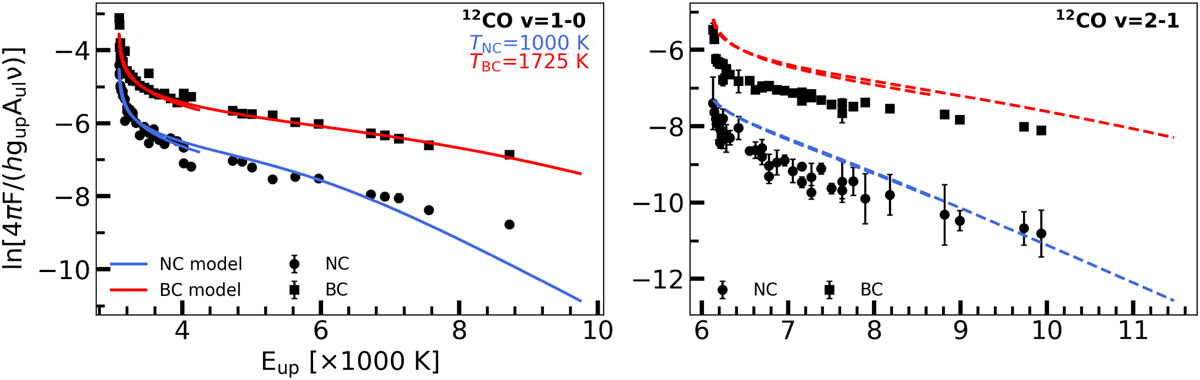
Comparison between the rotational diagrams of the 12CO v=1-0 and v=2-1 transitions to test the assumption of LTE. The left panel shows the 12CO v=1-0 rotational diagrams (see also Figure 8). The right panel shows the non-LTE test, where the 12CO v=2-1 integrated fluxes are shown together with expected the models based on the results of the 12CO v=1-0 rotational diagrams. As the models overproduce the observed 12CO v=2-1 fluxes, invalidating the assumption that the levels can be characterised by a single temperature.
Current usage metrics show cumulative count of Article Views (full-text article views including HTML views, PDF and ePub downloads, according to the available data) and Abstracts Views on Vision4Press platform.
Data correspond to usage on the plateform after 2015. The current usage metrics is available 48-96 hours after online publication and is updated daily on week days.
Initial download of the metrics may take a while.