Fig. D.2
Download original image
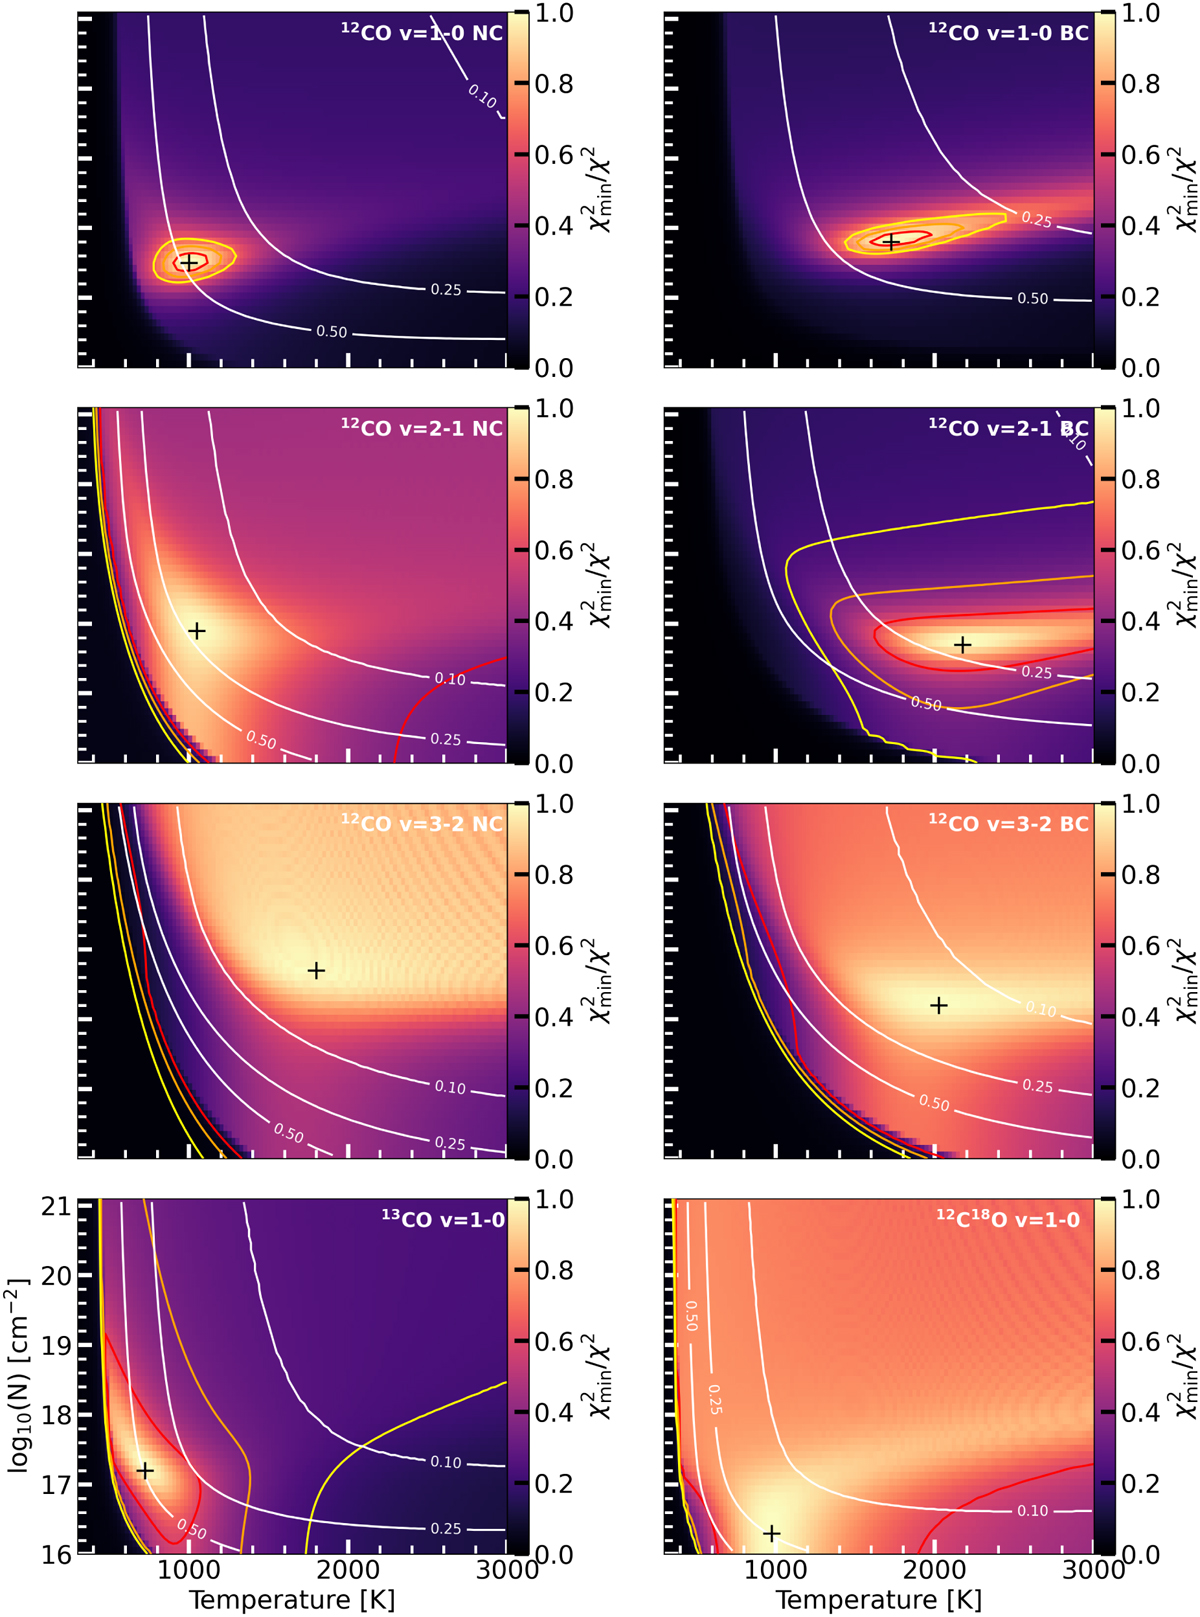
Similar as Figure C.1, but for the iSHELL CO rotational diagrams. The top row shows those for the narrow (left) and broad (right) component of 12CO v=1-0 transitions. Those for the 12CO v=2-1 and v=3-2 transitions are shown on the second and third row, respectively, whereas the ones for the 13CO and C18O (using VLT-CRIRES data) are shown on the bottom row.
Current usage metrics show cumulative count of Article Views (full-text article views including HTML views, PDF and ePub downloads, according to the available data) and Abstracts Views on Vision4Press platform.
Data correspond to usage on the plateform after 2015. The current usage metrics is available 48-96 hours after online publication and is updated daily on week days.
Initial download of the metrics may take a while.