Fig. D.1
Download original image
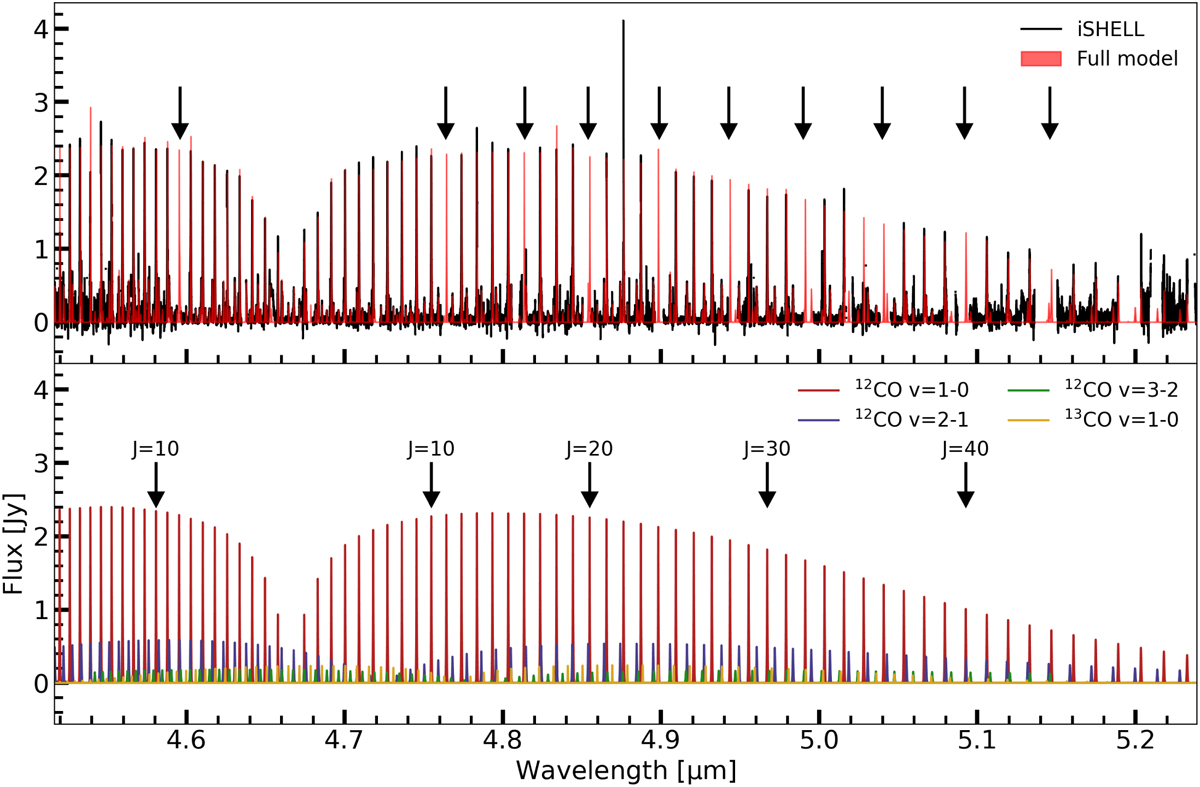
Continuum-subtracted iSHELL spectrum of DR Tau with a model based on the best-fitting parameters obtained through the rotational diagram analysis. The gaps visible (highlighted by the black arrows in the top panel) in the iSHELL spectrum correspond to removed telluric features. The top panel shows the full model, whereas the bottom panel shows the contribution of each band separately. For 12CO, the narrow and broad component are shown together. In addition, in the bottom panel we highlight the 12CO transitions which have an upper level J-value of 10, 20, 30, or 40.
Current usage metrics show cumulative count of Article Views (full-text article views including HTML views, PDF and ePub downloads, according to the available data) and Abstracts Views on Vision4Press platform.
Data correspond to usage on the plateform after 2015. The current usage metrics is available 48-96 hours after online publication and is updated daily on week days.
Initial download of the metrics may take a while.