Open Access
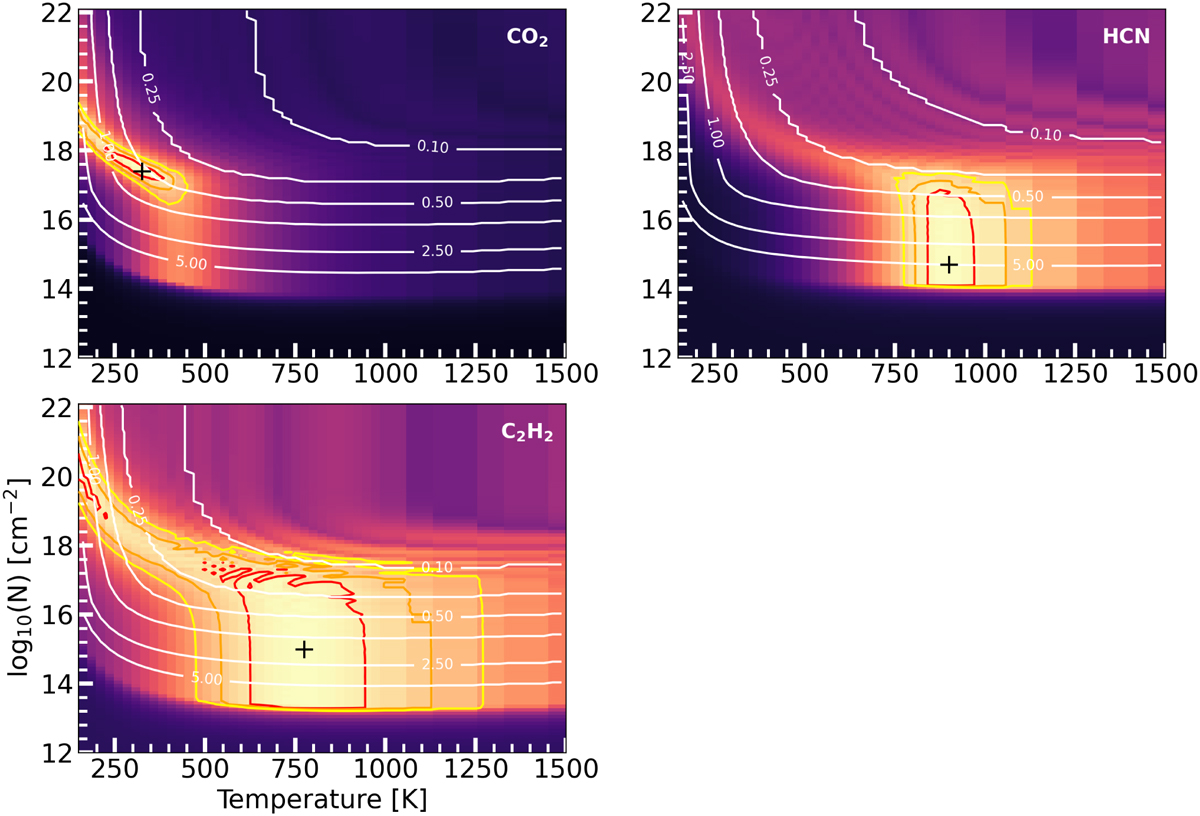
Fig. C.1
Download original image
Normalised χ2 maps ![]() for CO2 (top left), HCN (top right), and C2H2 (bottom left). The dark plus indicates the best fitting parameters, while red, orange, and yellow contours indicate the 1σ-, 2σ-, and 3σ-confidence intervals, respectively. The white contours indicate the emitting radii in au.
for CO2 (top left), HCN (top right), and C2H2 (bottom left). The dark plus indicates the best fitting parameters, while red, orange, and yellow contours indicate the 1σ-, 2σ-, and 3σ-confidence intervals, respectively. The white contours indicate the emitting radii in au.
Current usage metrics show cumulative count of Article Views (full-text article views including HTML views, PDF and ePub downloads, according to the available data) and Abstracts Views on Vision4Press platform.
Data correspond to usage on the plateform after 2015. The current usage metrics is available 48-96 hours after online publication and is updated daily on week days.
Initial download of the metrics may take a while.