Fig. 11
Download original image
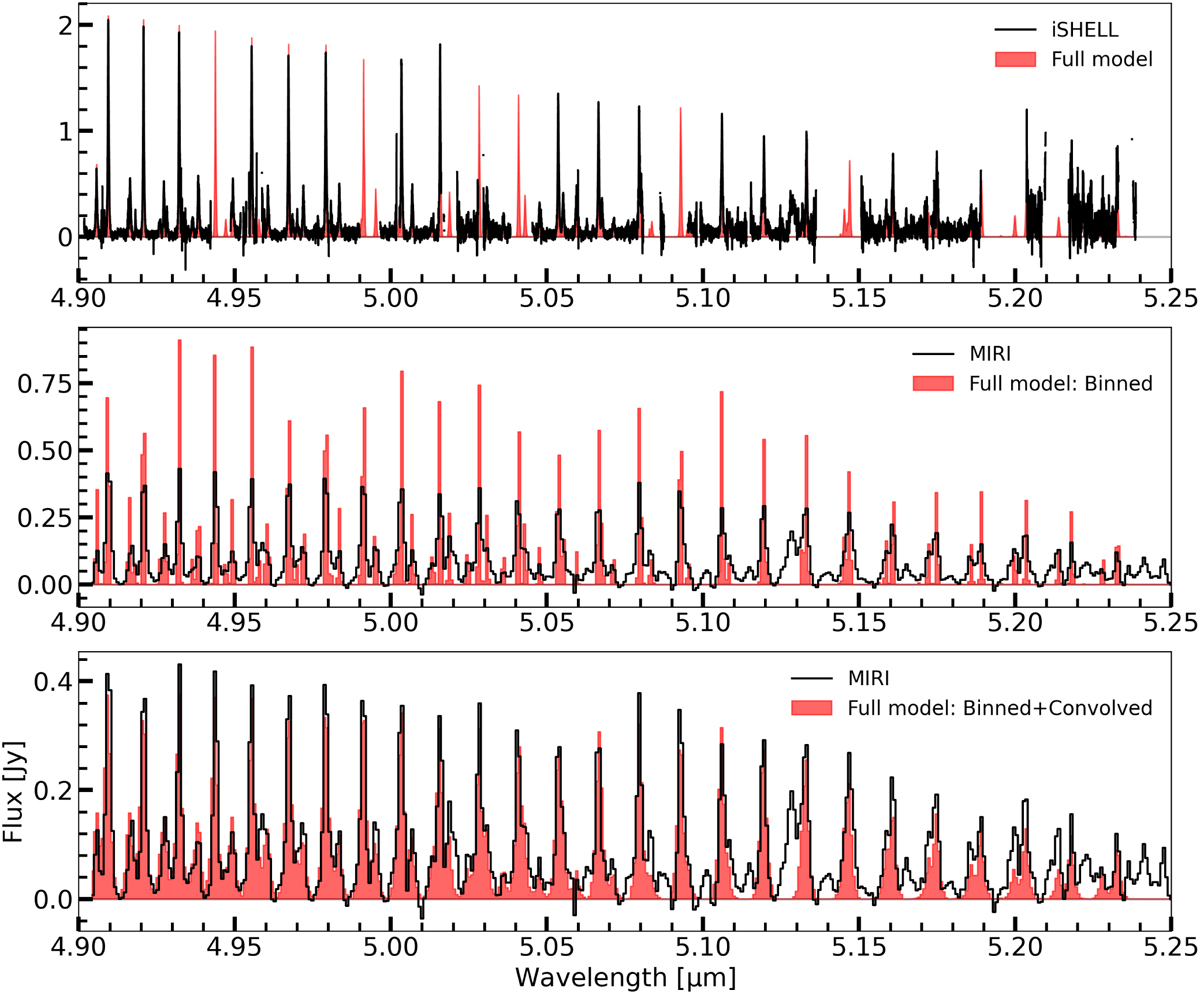
Top panel: continuum-subtracted iSHELL data (black) with the best-fitting model (red) based on the various slab model fits to the rotational diagrams over the 4.90–5.25 µm wavelength region. The middle panel shows the best fitting model binned to the JWST-MIRI resolution together with the JWST-MIRI observations, whereas the bottom panel shows the model convolved with the pseudo-Voigt profile shown in Fig. D.6.
Current usage metrics show cumulative count of Article Views (full-text article views including HTML views, PDF and ePub downloads, according to the available data) and Abstracts Views on Vision4Press platform.
Data correspond to usage on the plateform after 2015. The current usage metrics is available 48-96 hours after online publication and is updated daily on week days.
Initial download of the metrics may take a while.