Fig. 1
Download original image
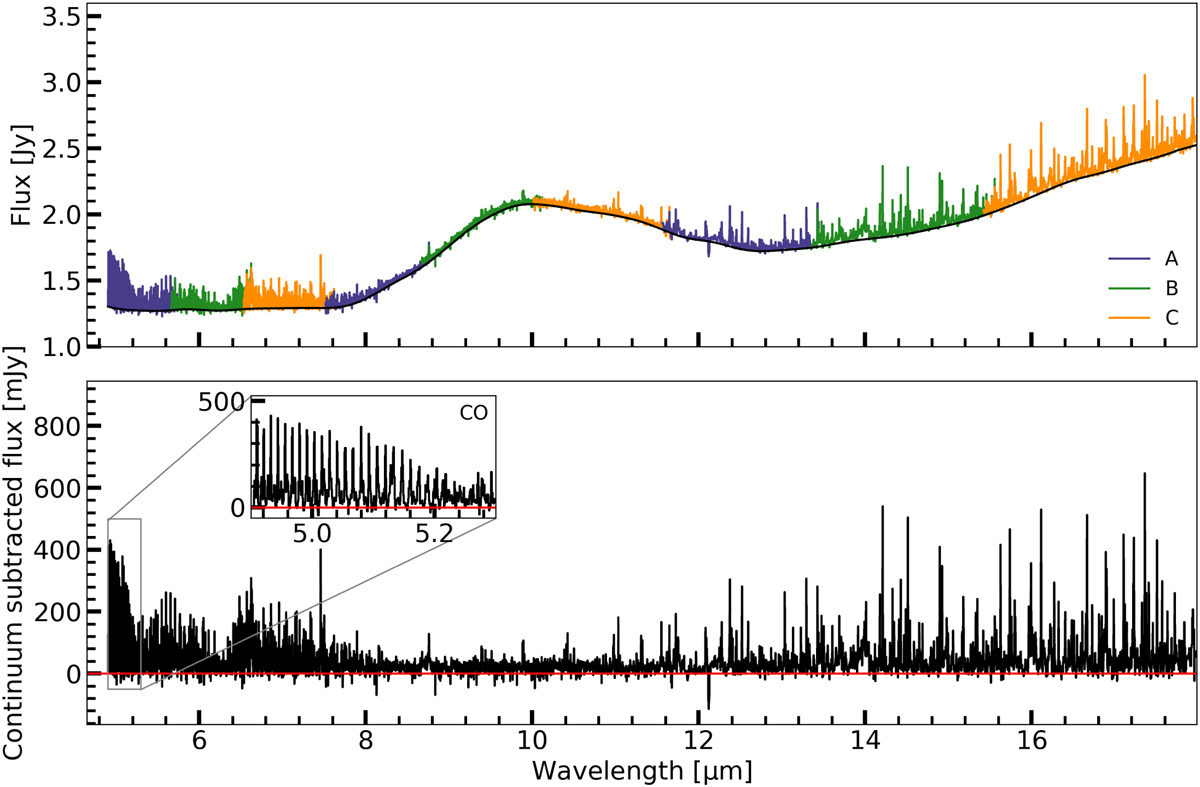
JWST-MIRI MRS spectrum of DR Tau over channels 1 through 3 (4.9–17.98 µm). The different wavelength ranges (subbands) of each MIRI channel are indicated in the top panel in blue (‘A’), green (‘B’)> and orange (‘C’), respectively. The black line displays the estimated continuum. The bottom panel shows the continuum subtracted JWST-MIRI spectrum and contains a zoom-in on the CO transitions (4.9–5.3 µm). The red line in the bottom panel highlights the zero flux level.
Current usage metrics show cumulative count of Article Views (full-text article views including HTML views, PDF and ePub downloads, according to the available data) and Abstracts Views on Vision4Press platform.
Data correspond to usage on the plateform after 2015. The current usage metrics is available 48-96 hours after online publication and is updated daily on week days.
Initial download of the metrics may take a while.