Fig. 8.
Download original image
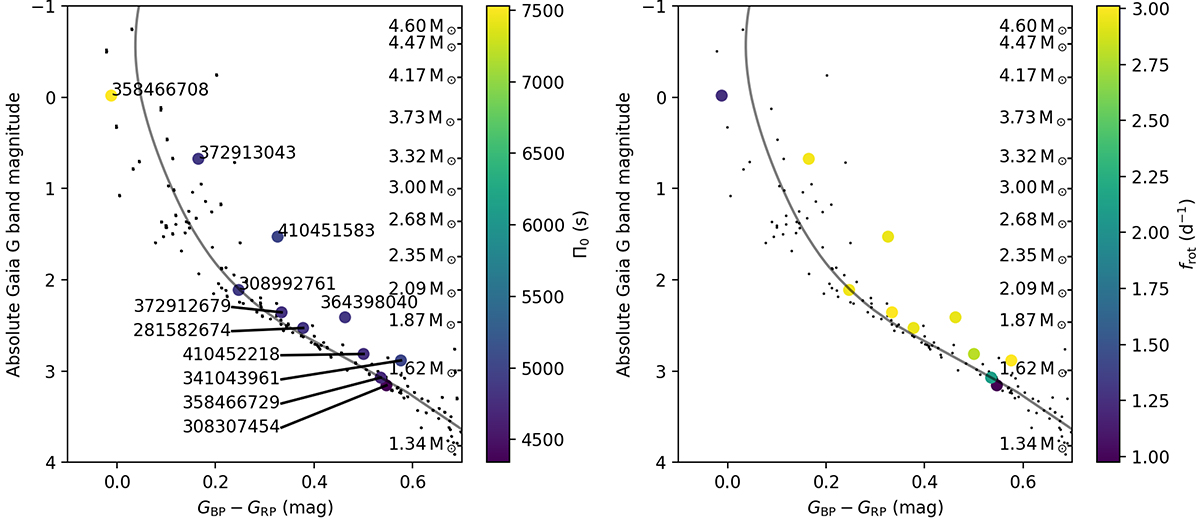
Location of γ Dor stars on CMD with best-fitting isochrone. The large circles show the γ Dor stars with clear period spacings, colour-coded by their buoyancy travel time (left panel) or near-core rotation rates (right panel). The black dots are the other cluster members, and the grey solid line is the best-fitting isochrone. We also indicate the masses of the models on the right edges of each panel. In the left panel, we show the TIC numbers of the stars.
Current usage metrics show cumulative count of Article Views (full-text article views including HTML views, PDF and ePub downloads, according to the available data) and Abstracts Views on Vision4Press platform.
Data correspond to usage on the plateform after 2015. The current usage metrics is available 48-96 hours after online publication and is updated daily on week days.
Initial download of the metrics may take a while.