Open Access
Fig. 7.
Download original image
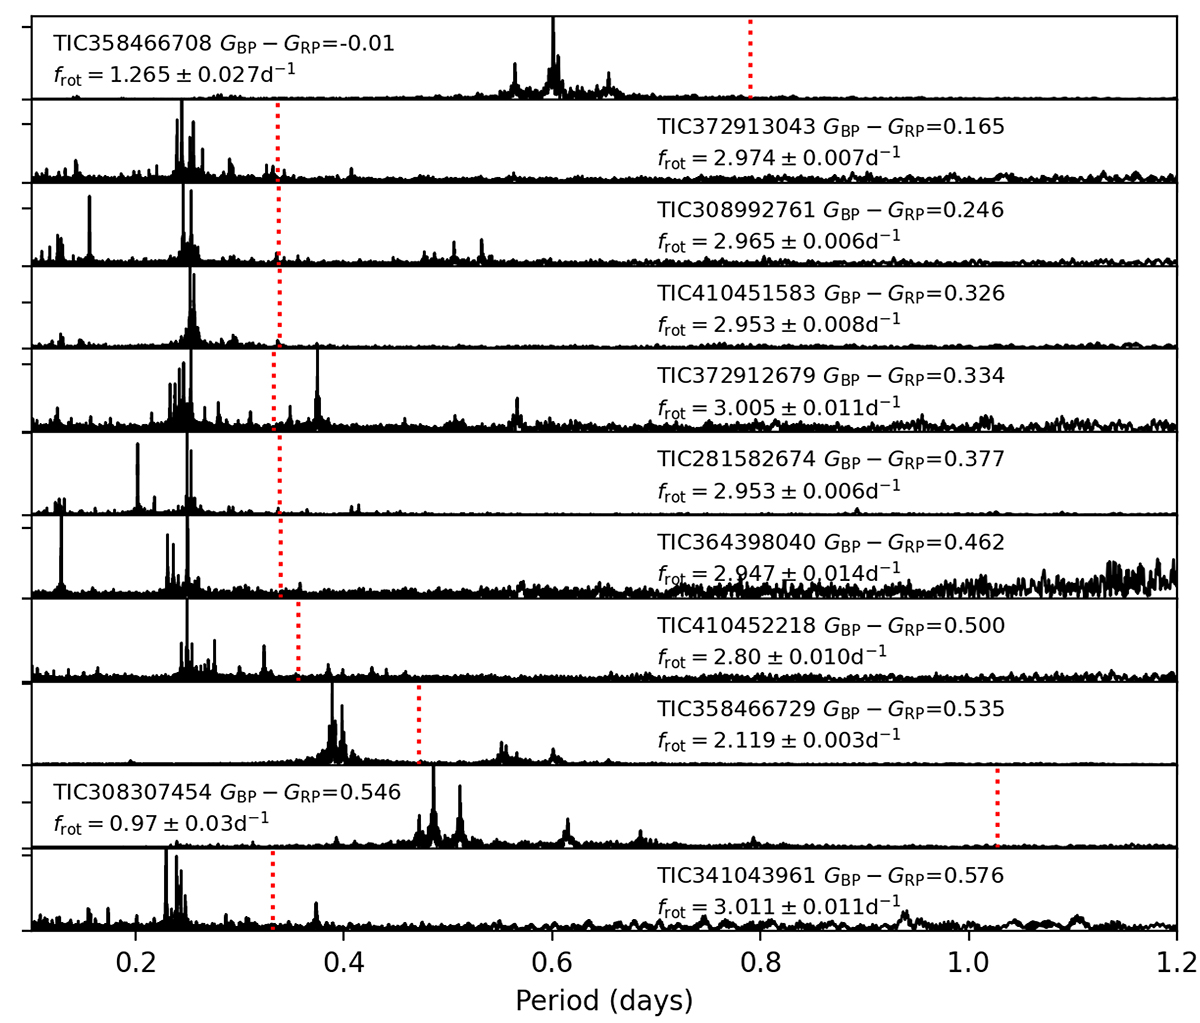
Eleven g-mode pulsators with clear period spacing patterns, sorted in descending order by their Gaia colour index GBP − GRP from top to bottom. The red vertical lines mark their near-core rotation periods derived from the modes by adopting the TAR.
Current usage metrics show cumulative count of Article Views (full-text article views including HTML views, PDF and ePub downloads, according to the available data) and Abstracts Views on Vision4Press platform.
Data correspond to usage on the plateform after 2015. The current usage metrics is available 48-96 hours after online publication and is updated daily on week days.
Initial download of the metrics may take a while.