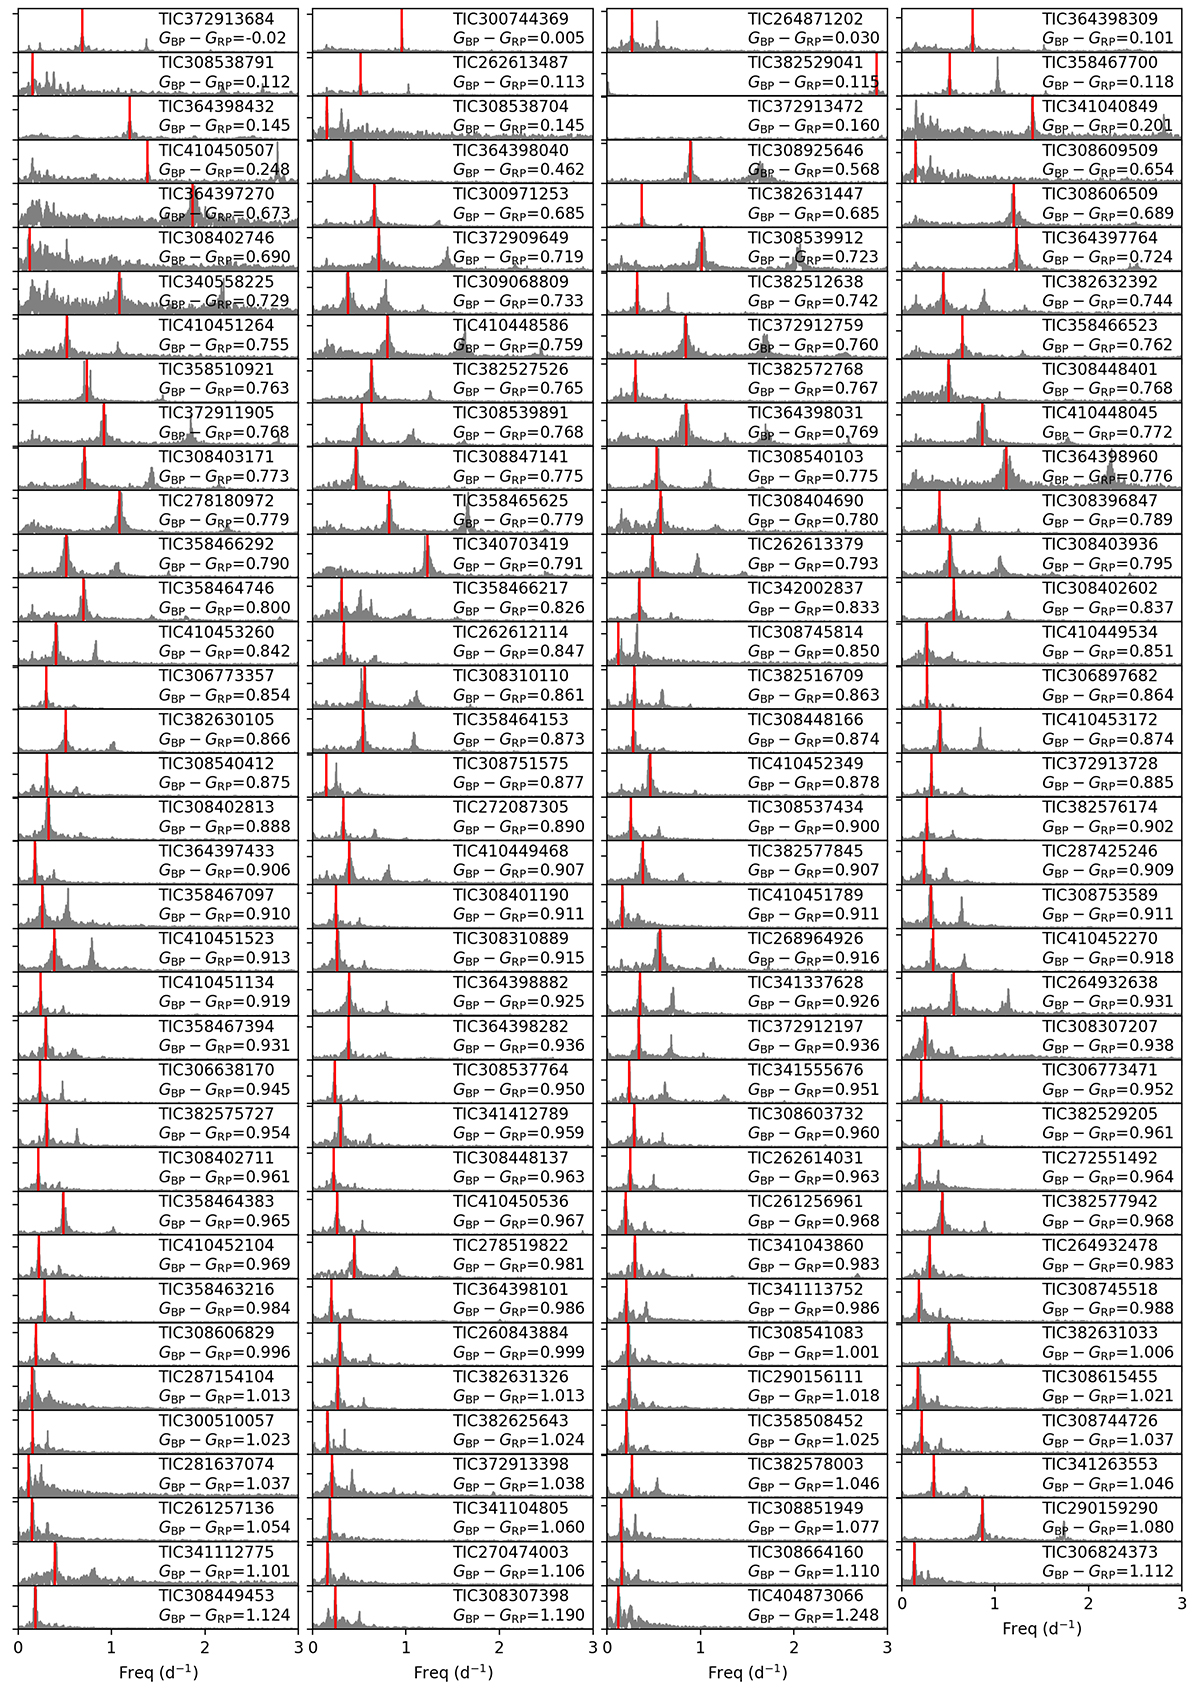
Fig. A.2.
Download original image
Surface modulation signals in stars of NGC 2516 sorted by Gaia colour index. Stars with smaller colour indices are displayed at the top. Frequency (in d−1) is plotted along the x-axis. The y-axis, representing amplitude, is omitted for brevity. Each panel displays the amplitude spectrum in grey, with the rotation frequency indicated by a vertical red line. The TIC number and corresponding Gaia colour index are noted in each panel.
Current usage metrics show cumulative count of Article Views (full-text article views including HTML views, PDF and ePub downloads, according to the available data) and Abstracts Views on Vision4Press platform.
Data correspond to usage on the plateform after 2015. The current usage metrics is available 48-96 hours after online publication and is updated daily on week days.
Initial download of the metrics may take a while.