Open Access
Fig. 13.
Download original image
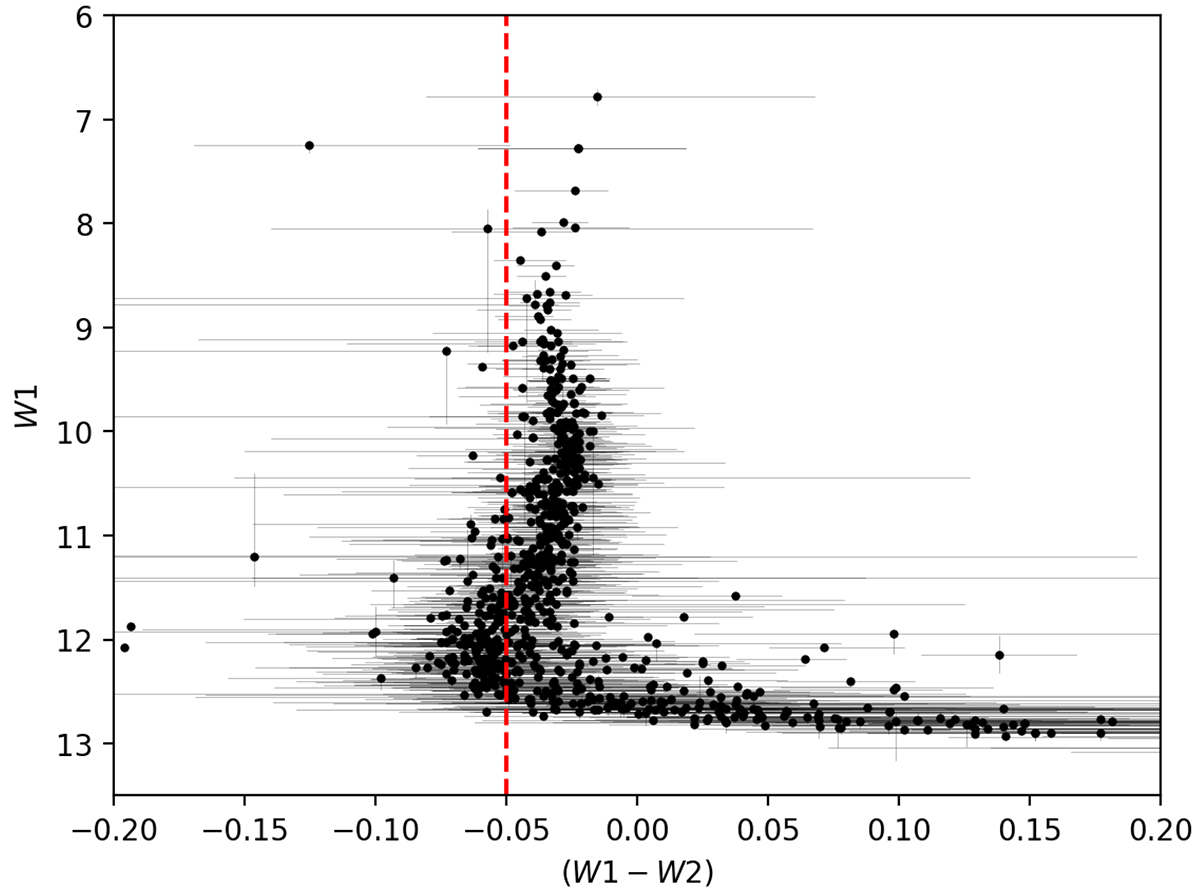
WISE colour-magnitude diagram of sample stars, with the median value of (W1 − W2) and W1 plotted as black dots, and their extreme values plotted as horizontal and vertical error bars. The red vertical-dashed line indicates the intrinsic colour (−0.05) of the stars with Teff > 6000 K.
Current usage metrics show cumulative count of Article Views (full-text article views including HTML views, PDF and ePub downloads, according to the available data) and Abstracts Views on Vision4Press platform.
Data correspond to usage on the plateform after 2015. The current usage metrics is available 48-96 hours after online publication and is updated daily on week days.
Initial download of the metrics may take a while.