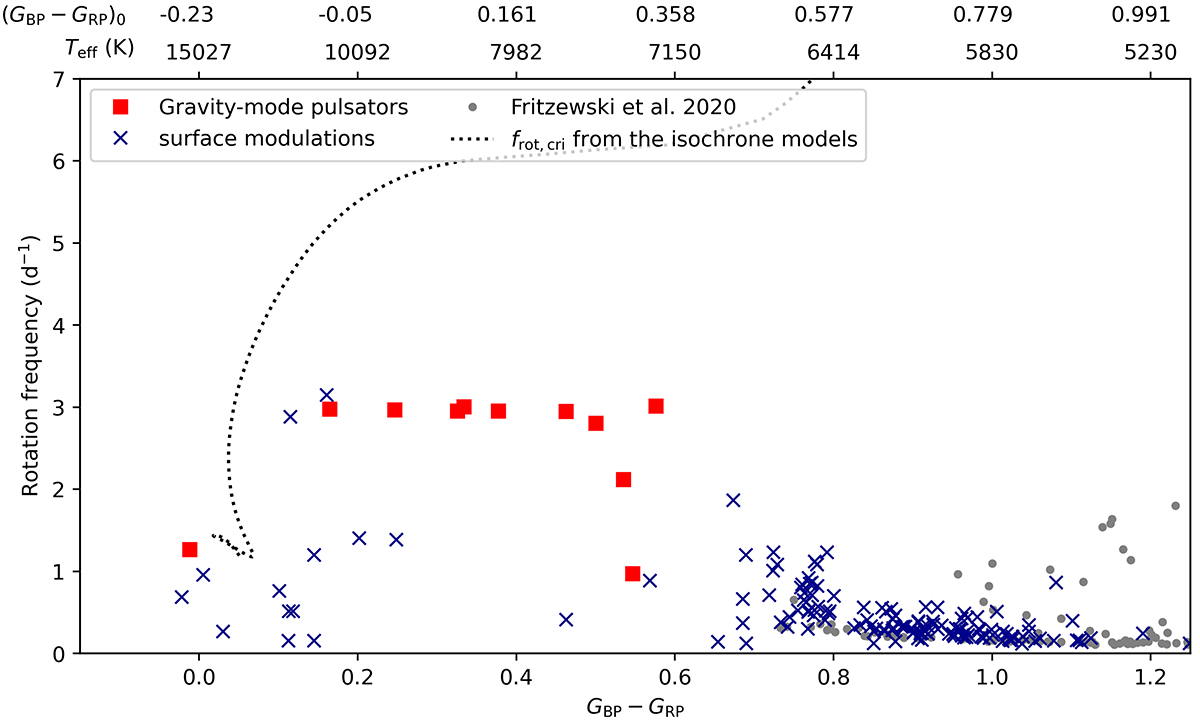
Fig. 12.
Download original image
Observed rotation rates for cluster members from surface modulations or g-mode pulsations as a function of colour index. The y-axis is the rotation frequency in d−1. The bottom x-axis shows the observed Gaia colour index, while the top x-axis shows both the effective temperature and the intrinsic Gaia colour index from the best-fitting isochrone. The red squares show cluster members with near-core rotation rates measured from their identified g modes, while the dark blue crosses are stars with surface rotation measurements from modulations in their light curves. Rotation uncertainties are typically smaller than the marker sizes. The grey dots are the surface rotation rates for the late-type stars used for gyrochronology in the cluster reported by Fritzewski et al. (2020). The black dotted line represents the Keplerian critical rotation rate frot, cri from the best-fitting isochrone model.
Current usage metrics show cumulative count of Article Views (full-text article views including HTML views, PDF and ePub downloads, according to the available data) and Abstracts Views on Vision4Press platform.
Data correspond to usage on the plateform after 2015. The current usage metrics is available 48-96 hours after online publication and is updated daily on week days.
Initial download of the metrics may take a while.