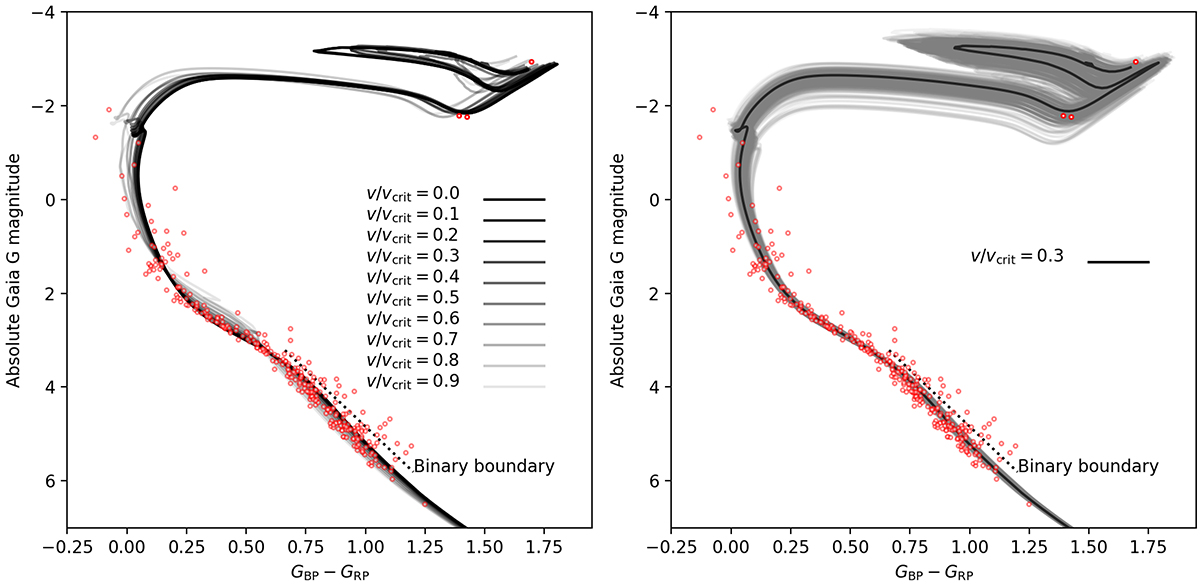
Fig. 1.
Download original image
Observed Gaia DR3 CMD of NGC 2516. Left panel: fits for isochrones with varying rotation rates. Isochrones with v/vcrit ≤ 0.4 effectively reproduce the observed data. Right panel: solid black isochrone represents the best-fitting result with v/vcrit = 0.3. The grey background tracks collectively represent the uncertainty, which is determined using a set of 500 isochrones randomly selected from the Monte Carlo approach explained in the main text. The dotted line marks the boundary of the binary sequence.
Current usage metrics show cumulative count of Article Views (full-text article views including HTML views, PDF and ePub downloads, according to the available data) and Abstracts Views on Vision4Press platform.
Data correspond to usage on the plateform after 2015. The current usage metrics is available 48-96 hours after online publication and is updated daily on week days.
Initial download of the metrics may take a while.