Fig. 4.
Download original image
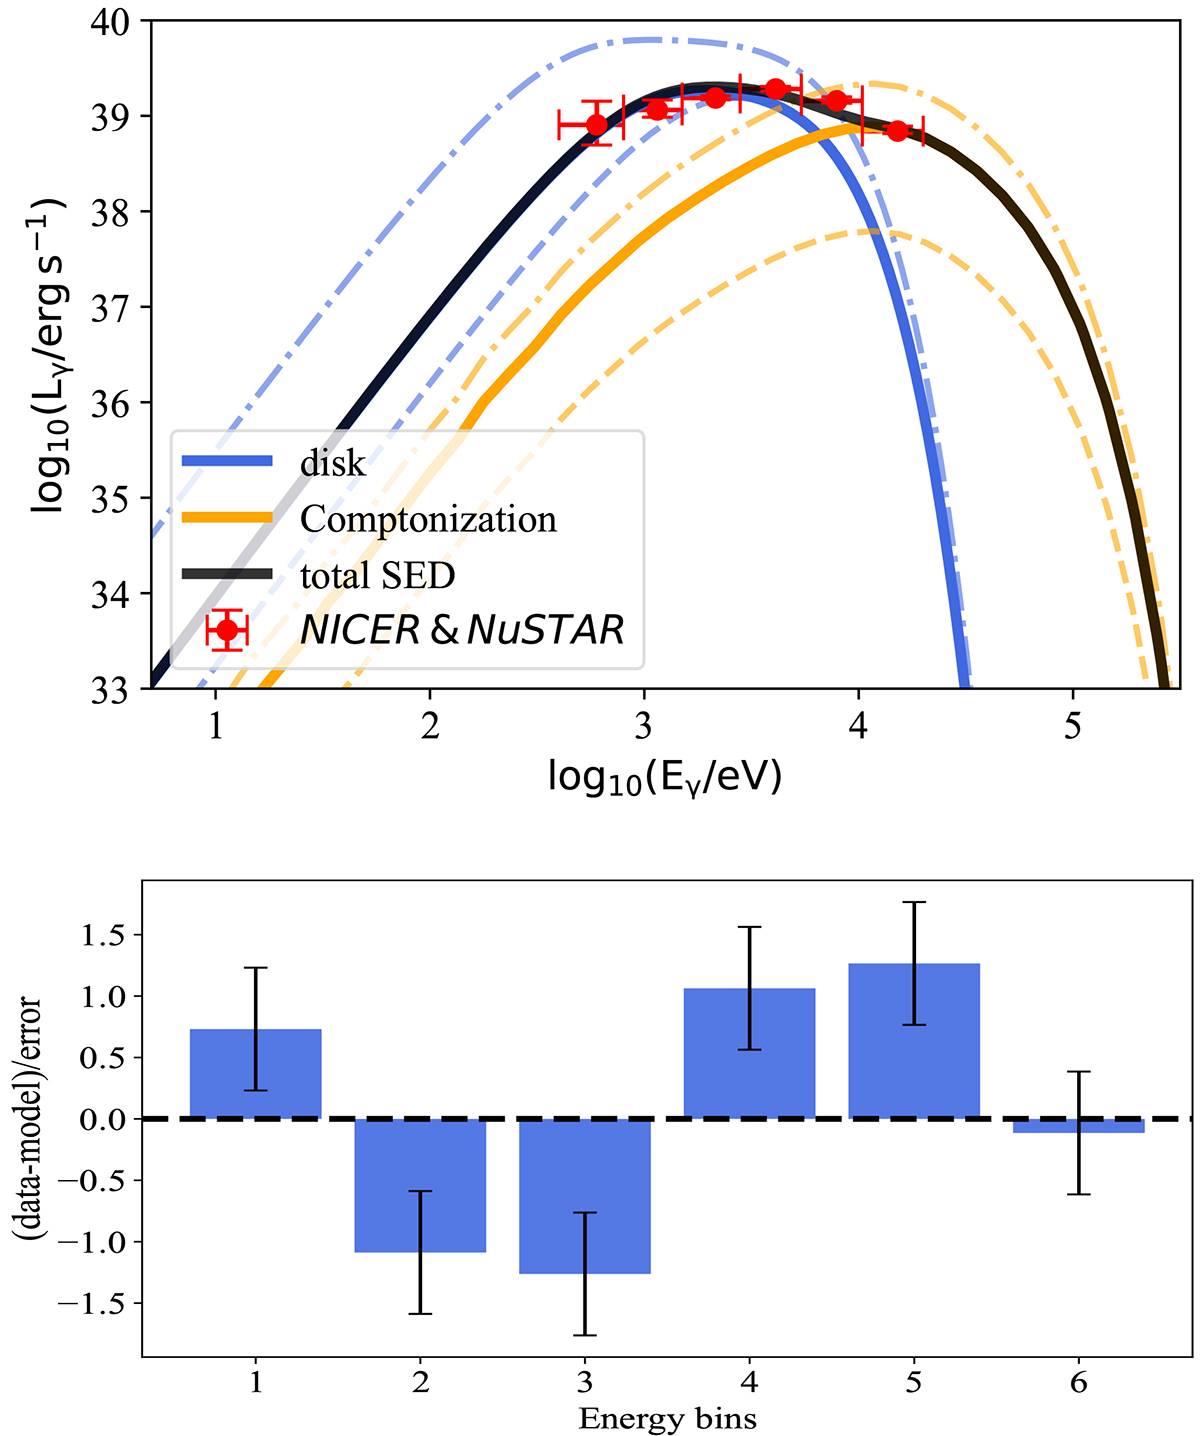
Top: SED of the X-ray emission of NGC 4190 ULX-1 on a logarithmic scale. We plot the radiation from the innermost part of the disk that escapes through the funnel (blue line) and the radiation produced by Comptonization of the disk emission by nonthermal electrons in the funnel (orange line). The black line represents the total SED, while red dots correspond to energy-binned observations from NICER and NuSTAR. We also present, for comparison, the application of our model assuming an accretion rate of 1 ṀEdd (dashed lines) and of 15 ṀEdd (dash-dotted lines). Bottom: residuals of the best fit. The six spectral bins correspond to the data in the 0.4 − 20 keV energy range.
Current usage metrics show cumulative count of Article Views (full-text article views including HTML views, PDF and ePub downloads, according to the available data) and Abstracts Views on Vision4Press platform.
Data correspond to usage on the plateform after 2015. The current usage metrics is available 48-96 hours after online publication and is updated daily on week days.
Initial download of the metrics may take a while.