Open Access
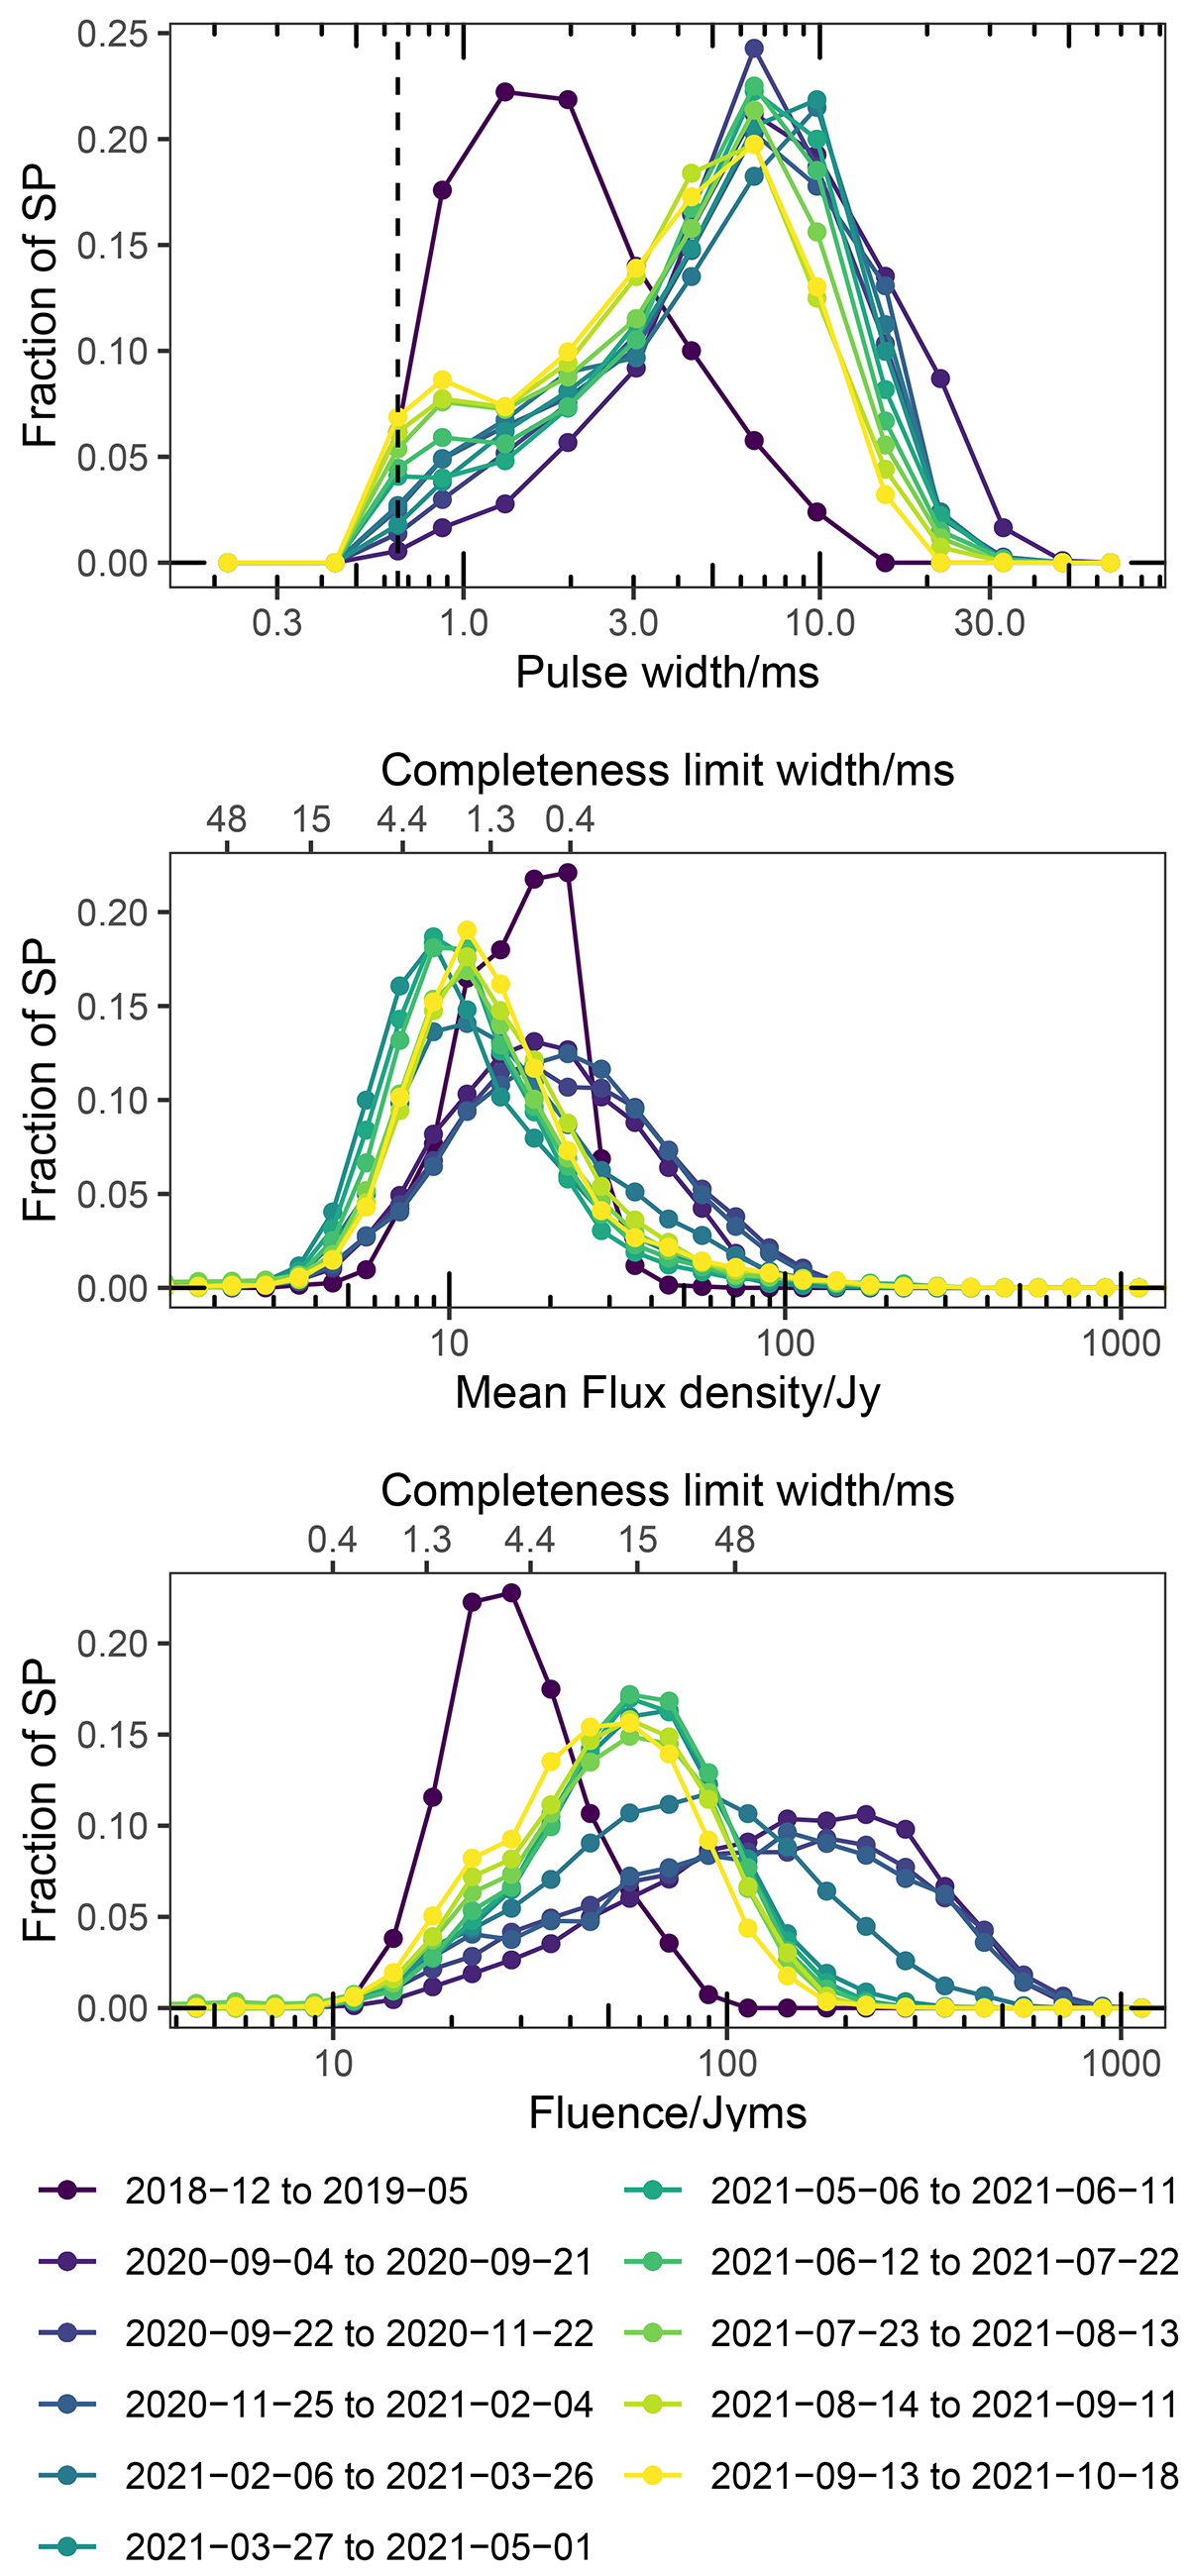
Fig. 8.
Download original image
Distribution for the single pulse properties width (top) mean flux density (middle), and fluence (bottom) for the single pulses in each data group as listed in Table 1. For the mean flux density and the fluence, the flux density or the fluence where specific pulse widths with a S/N below the detection threshold are marked.
Current usage metrics show cumulative count of Article Views (full-text article views including HTML views, PDF and ePub downloads, according to the available data) and Abstracts Views on Vision4Press platform.
Data correspond to usage on the plateform after 2015. The current usage metrics is available 48-96 hours after online publication and is updated daily on week days.
Initial download of the metrics may take a while.