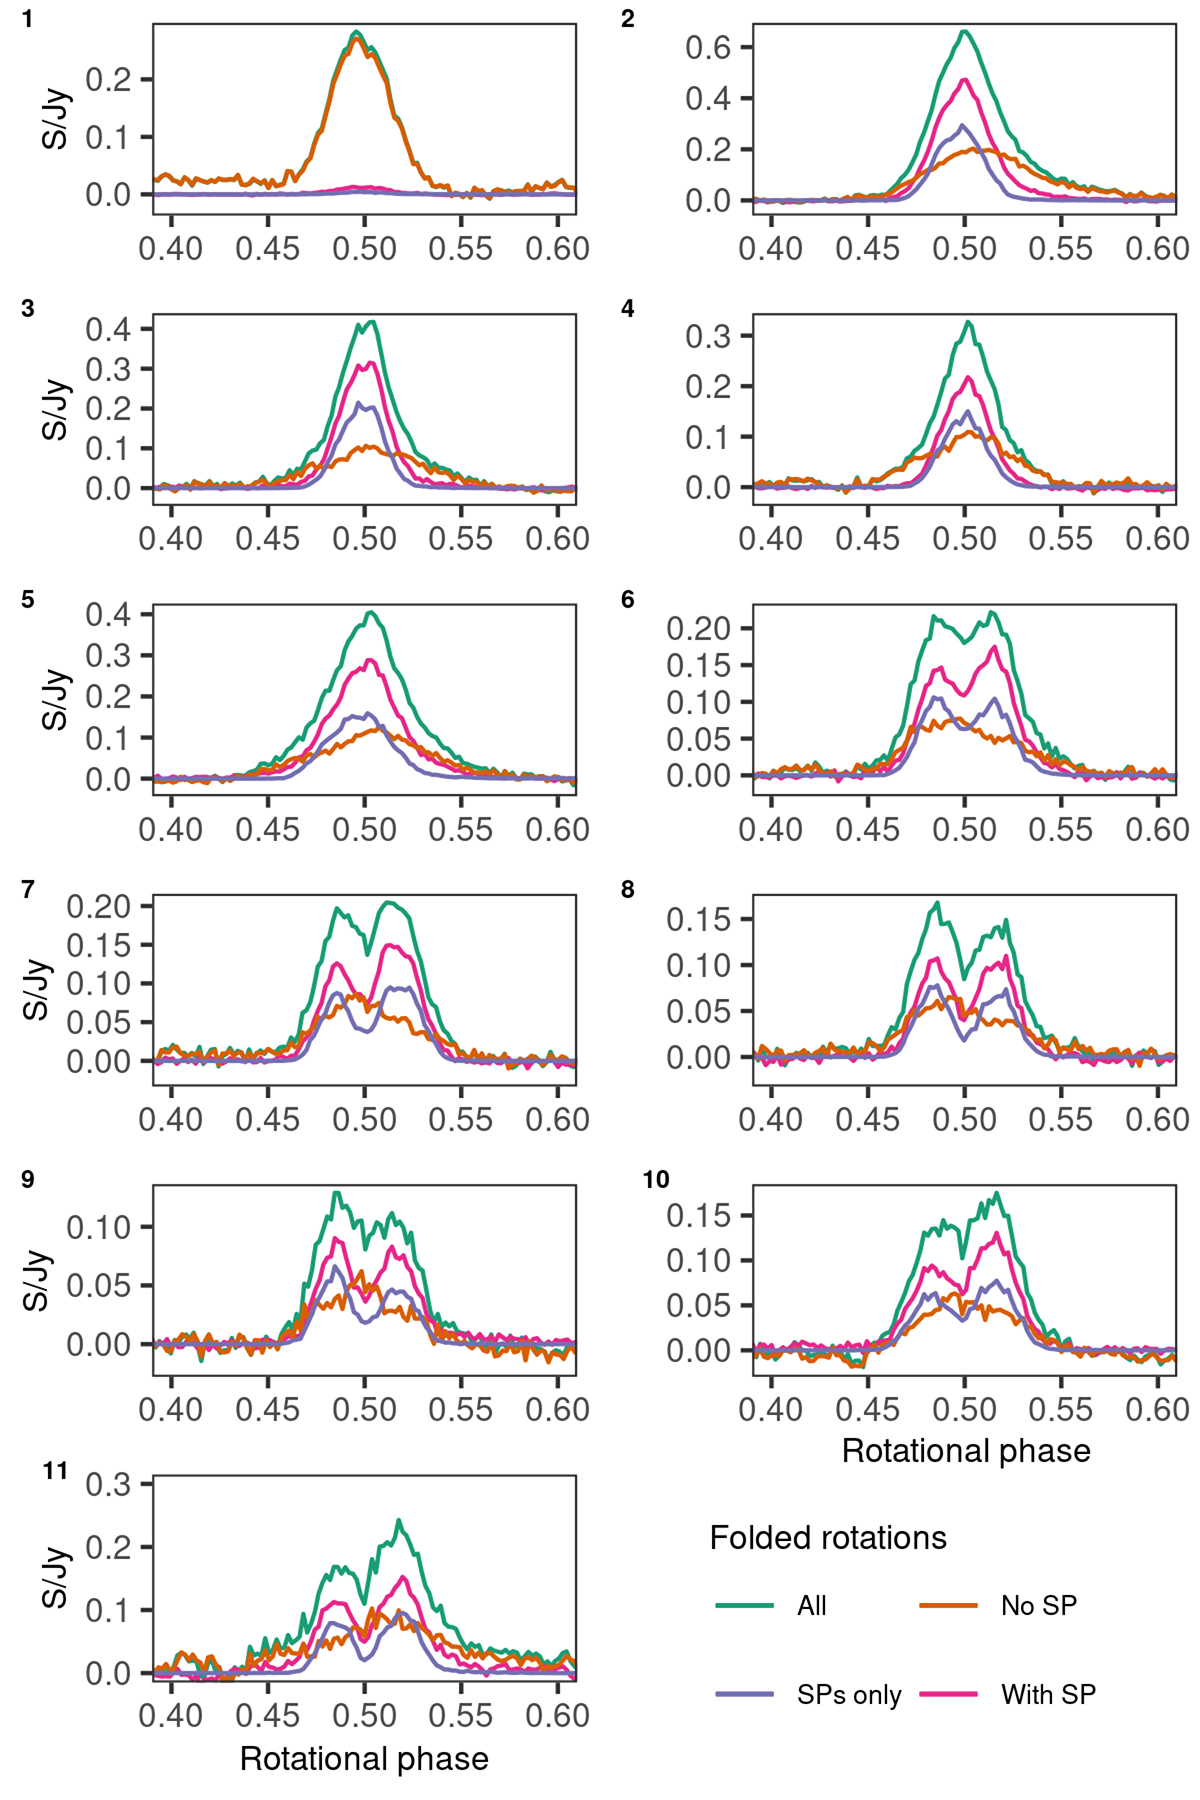
Fig. 6.
Download original image
Mean profiles for the observations in the data groups presented in Table 1. For each range, the overall profile resulting from all rotations (All), the rotations without a detected single pulse (No SP) and those with a detected single pulse (With SP) are shown. Additionally, the profiles from the single pulse emission only (SPs only) are included.
Current usage metrics show cumulative count of Article Views (full-text article views including HTML views, PDF and ePub downloads, according to the available data) and Abstracts Views on Vision4Press platform.
Data correspond to usage on the plateform after 2015. The current usage metrics is available 48-96 hours after online publication and is updated daily on week days.
Initial download of the metrics may take a while.