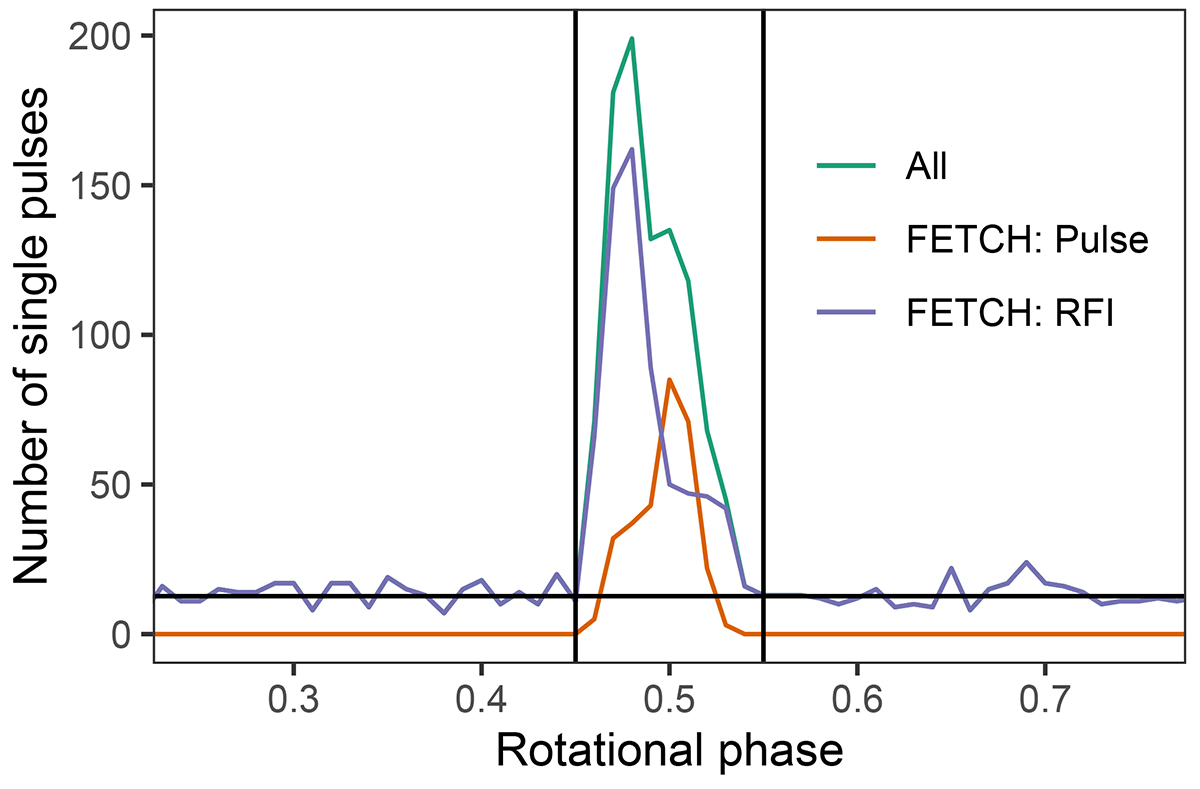
Fig. 2.
Download original image
Distribution of the single pulse candidates in the rotational phase in an observation in April 2021. The three profiles correspond to the labels from FETCH and all single pulse candidates. The horizontal lines represents the average number of pulses in the off-pulse window while the two vertical lines mark the emission window of single pulses.
Current usage metrics show cumulative count of Article Views (full-text article views including HTML views, PDF and ePub downloads, according to the available data) and Abstracts Views on Vision4Press platform.
Data correspond to usage on the plateform after 2015. The current usage metrics is available 48-96 hours after online publication and is updated daily on week days.
Initial download of the metrics may take a while.