Open Access
Fig. 13.
Download original image
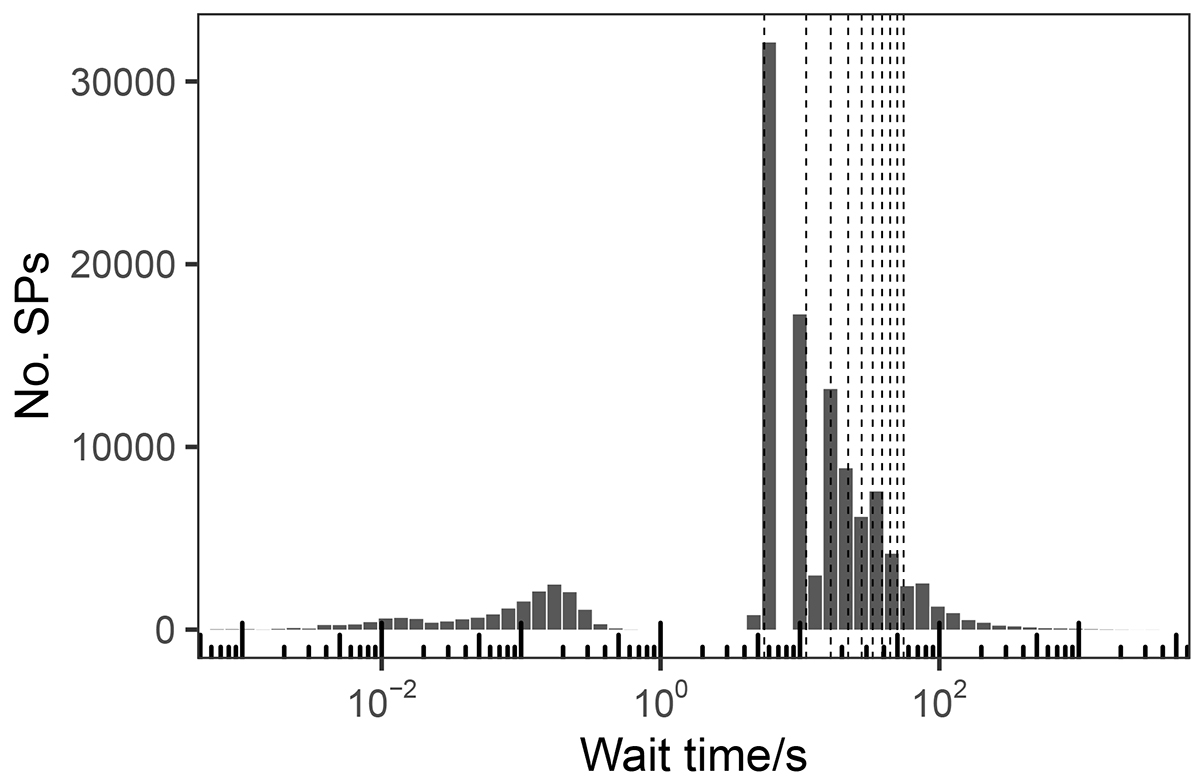
Waiting time distribution for the detected single pulses of the observations since September 2020. The vertical lines mark multiples of the rotational period (5.542 s).
Current usage metrics show cumulative count of Article Views (full-text article views including HTML views, PDF and ePub downloads, according to the available data) and Abstracts Views on Vision4Press platform.
Data correspond to usage on the plateform after 2015. The current usage metrics is available 48-96 hours after online publication and is updated daily on week days.
Initial download of the metrics may take a while.