Open Access
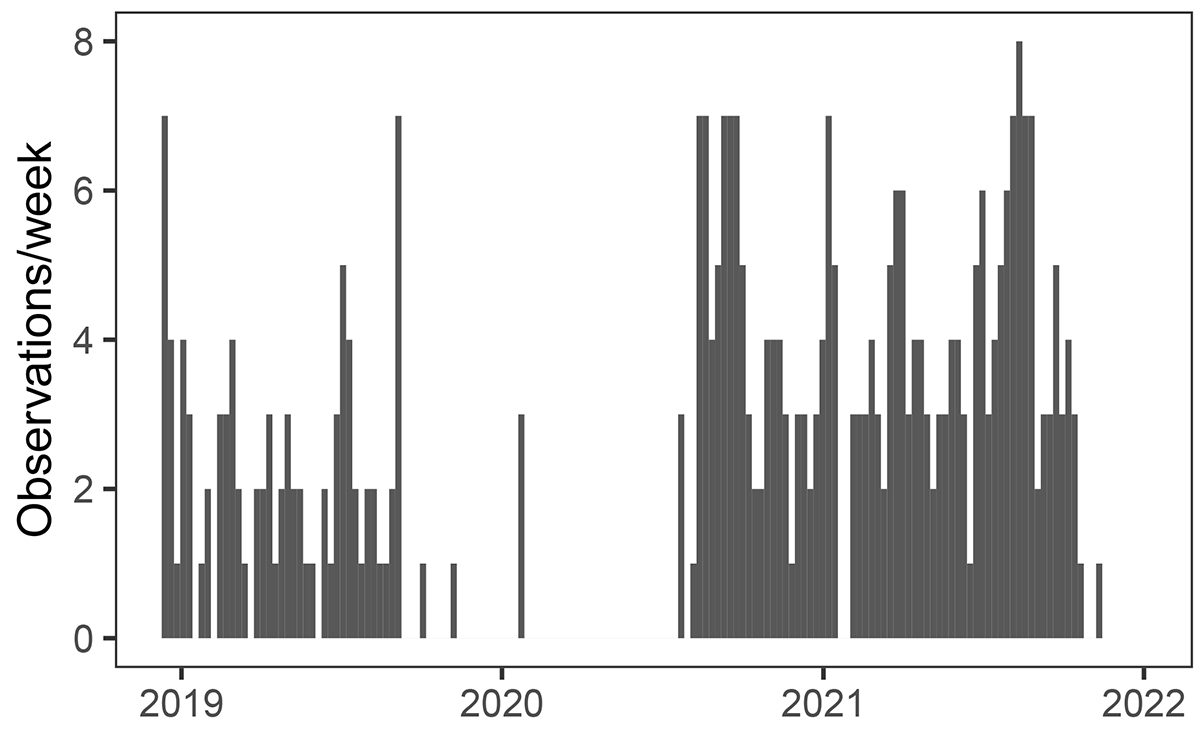
Fig. 1.
Download original image
Number of observations per week over the observational campaign. The observations were stopped between mid 2019 and mid 2020 as the magnetar was not seen in the folded profile.
Current usage metrics show cumulative count of Article Views (full-text article views including HTML views, PDF and ePub downloads, according to the available data) and Abstracts Views on Vision4Press platform.
Data correspond to usage on the plateform after 2015. The current usage metrics is available 48-96 hours after online publication and is updated daily on week days.
Initial download of the metrics may take a while.