Fig. 9.
Download original image
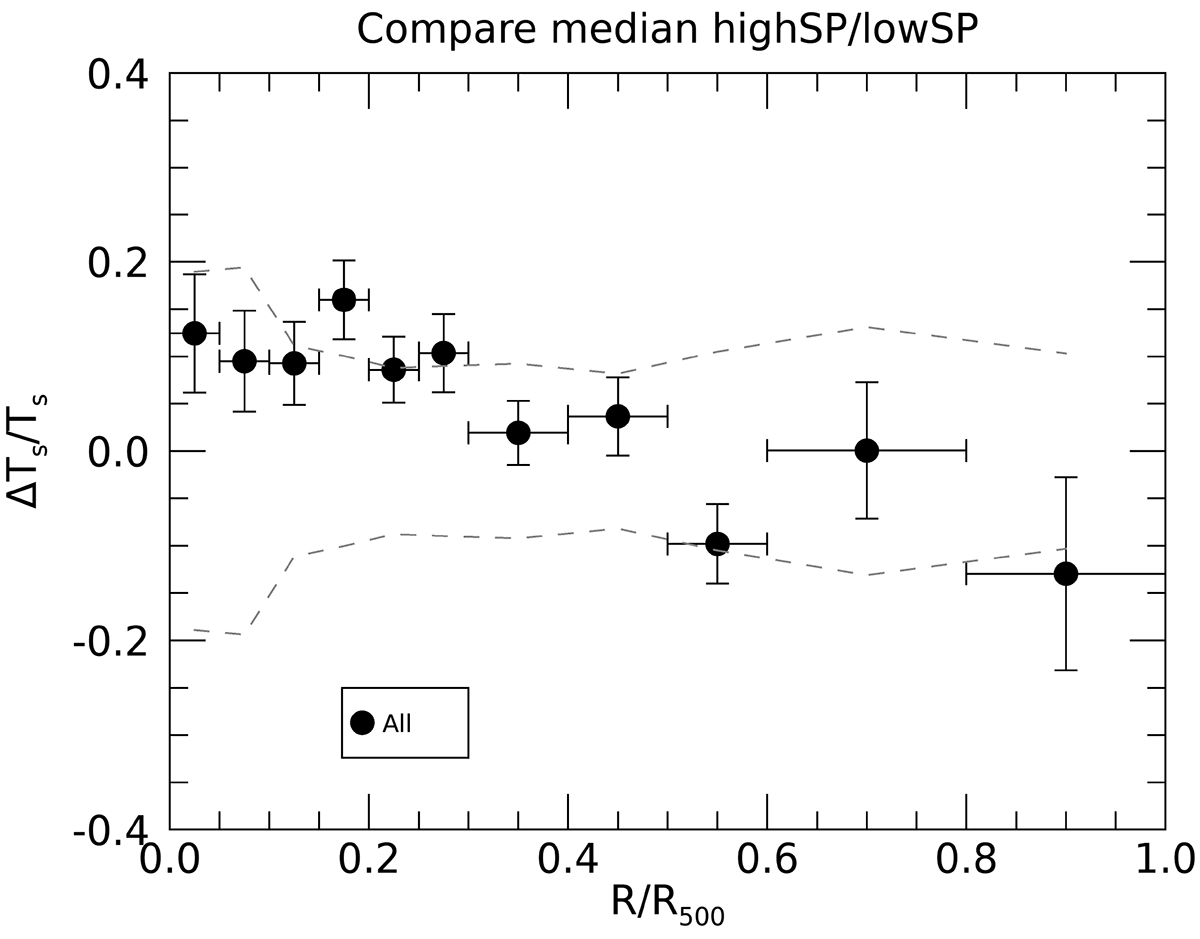
Ratio of the difference between the median scaled temperature profiles for the subsample with high contamination with respect to the low contamination sample. The points show the ratio between the median value in each bin, while the dashed lines mark the observed dispersion, which is typically larger than the measured difference, preventing its interpretation as a systematic bias.
Current usage metrics show cumulative count of Article Views (full-text article views including HTML views, PDF and ePub downloads, according to the available data) and Abstracts Views on Vision4Press platform.
Data correspond to usage on the plateform after 2015. The current usage metrics is available 48-96 hours after online publication and is updated daily on week days.
Initial download of the metrics may take a while.