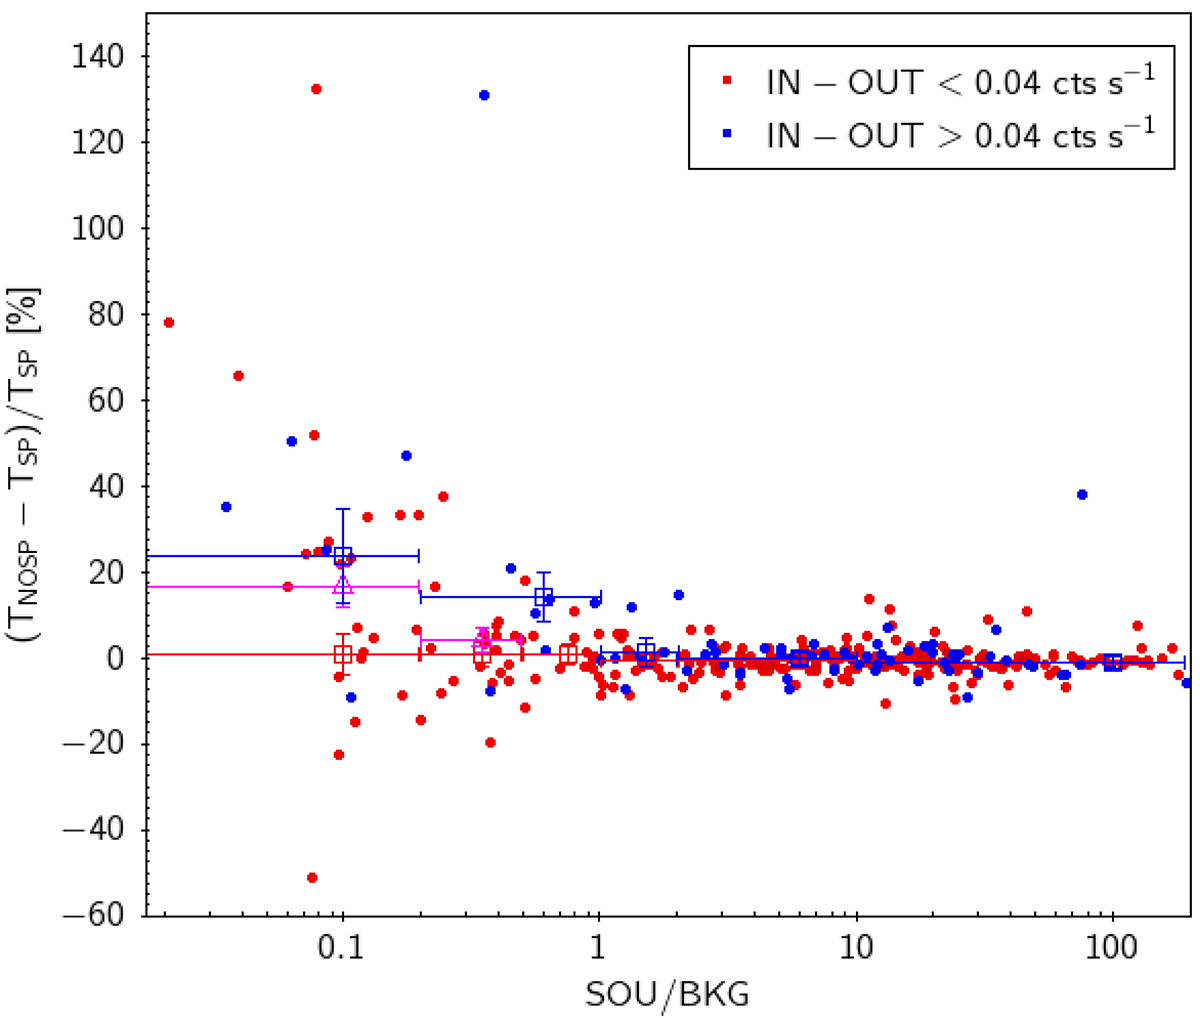
Fig. 8.
Download original image
Ratio of the difference between the temperature values obtained neglecting the soft proton component (TNOSP) and the one of our pipeline (TSP, including a SP component) over TSP in percent units, as a function of the SOU/BKG ratio in the spectral region. Filled points show the individual measurements (error bars not shown for clarity), while the open squares represent the weighted mean ratio and its error in different intervals of SOU/BKG. Blue points refer to measurements in observations with a significant residual contamination (inFOV − outFOV > 0.04 cts s−1), red are for observations with a low contamination. The magenta triangles shows the median value for clusters with low contamination, when the median is significantly different from the mean.
Current usage metrics show cumulative count of Article Views (full-text article views including HTML views, PDF and ePub downloads, according to the available data) and Abstracts Views on Vision4Press platform.
Data correspond to usage on the plateform after 2015. The current usage metrics is available 48-96 hours after online publication and is updated daily on week days.
Initial download of the metrics may take a while.