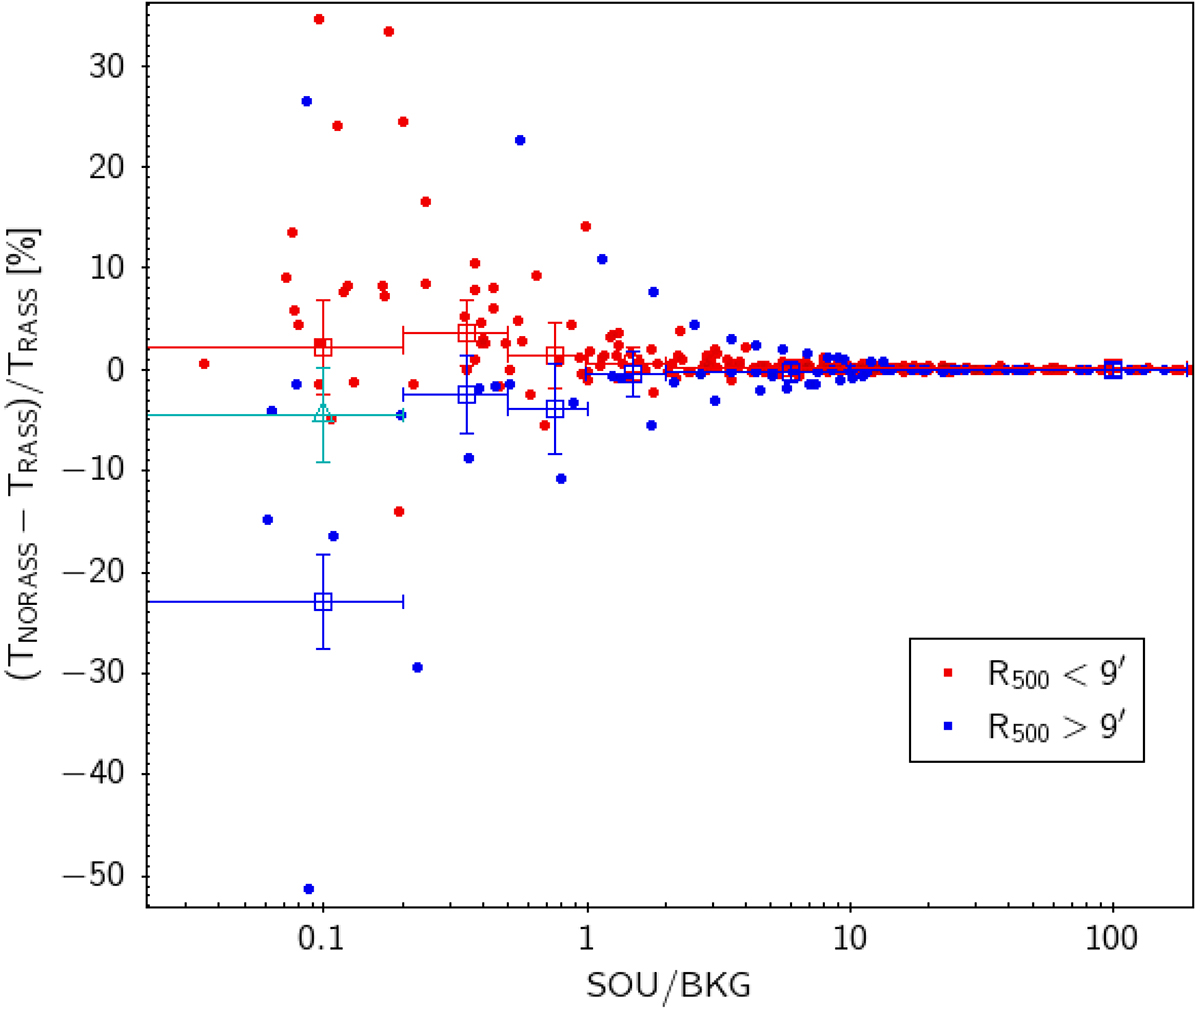
Fig. 7.
Download original image
Ratio of the difference between the temperature values obtained using XMM only in the background region (TNORASS) and that obtained with our standard pipeline (TRASS, joint fit with RASS in the background region) over TRASS, in percent units, as a function of the SOU/BKG ratio in the spectral region. Filled points show the individual measurements (error bars not shown for clarity), while the open squares represent the weighted mean ratio and its error in different intervals of SOU/BKG. Blue points refer to measurements in clusters with R500 > 9′, red are for the remaining objects. The cyan triangle shows the median value for the regions with SOU/BKG < 0.2 and clusters with R500 > 9′, significantly different than the mean with the same criteria.
Current usage metrics show cumulative count of Article Views (full-text article views including HTML views, PDF and ePub downloads, according to the available data) and Abstracts Views on Vision4Press platform.
Data correspond to usage on the plateform after 2015. The current usage metrics is available 48-96 hours after online publication and is updated daily on week days.
Initial download of the metrics may take a while.