Open Access
Fig. 6.
Download original image
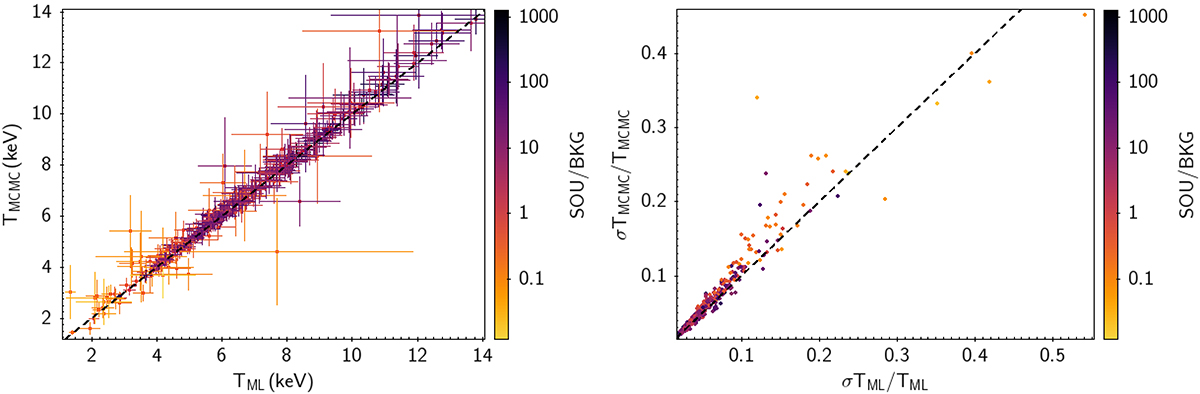
Comparison of best-fit temperature values (left panel) and relative symmetric errors (right panel) for all clusters and all regions obtained with the standard ML technique (x-axis) and with the MCMC approach (y-axis). The color coding refers to the SOU/BKG ratio in each region, the dashed line represents the equality line.
Current usage metrics show cumulative count of Article Views (full-text article views including HTML views, PDF and ePub downloads, according to the available data) and Abstracts Views on Vision4Press platform.
Data correspond to usage on the plateform after 2015. The current usage metrics is available 48-96 hours after online publication and is updated daily on week days.
Initial download of the metrics may take a while.