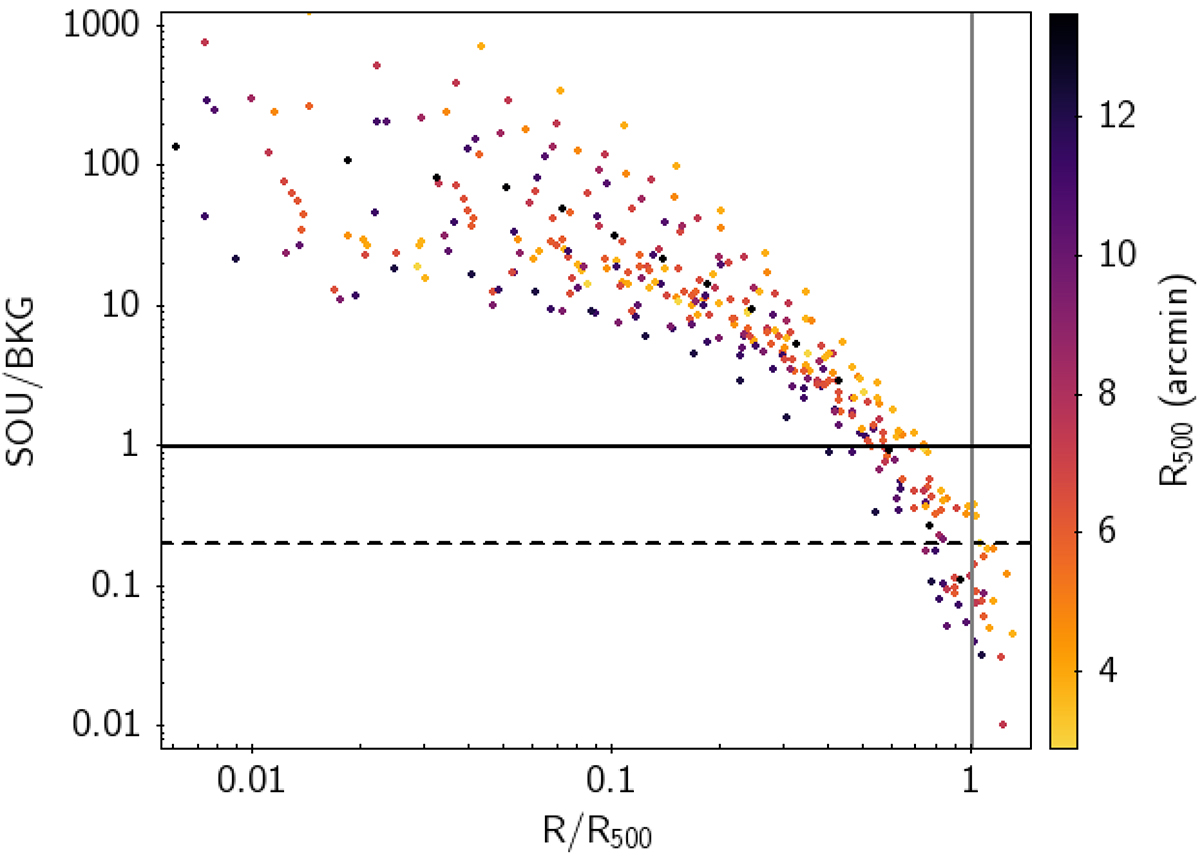
Fig. 5.
Download original image
Distribution of the SOU/BKG indicator for MOS2 as a function of scaled radius, for all the 354 regions from which we extracted spectra. The color coding refers to the extension in the sky (R500 in arcmin) of the corresponding cluster. The horizontal continuous line shows the value where the source intensity gets lower than the background line, while the dashed line marks the threshold SOU/BKG = 0.2 used in the analysis of mean and median profiles (Sect. 6.2). The vertical line marks R500. Most of the regions below the threshold SOU/BKG = 0.2 at R < R500 belong to very extended clusters and are thus located in poorly exposed regions of the FOV.
Current usage metrics show cumulative count of Article Views (full-text article views including HTML views, PDF and ePub downloads, according to the available data) and Abstracts Views on Vision4Press platform.
Data correspond to usage on the plateform after 2015. The current usage metrics is available 48-96 hours after online publication and is updated daily on week days.
Initial download of the metrics may take a while.