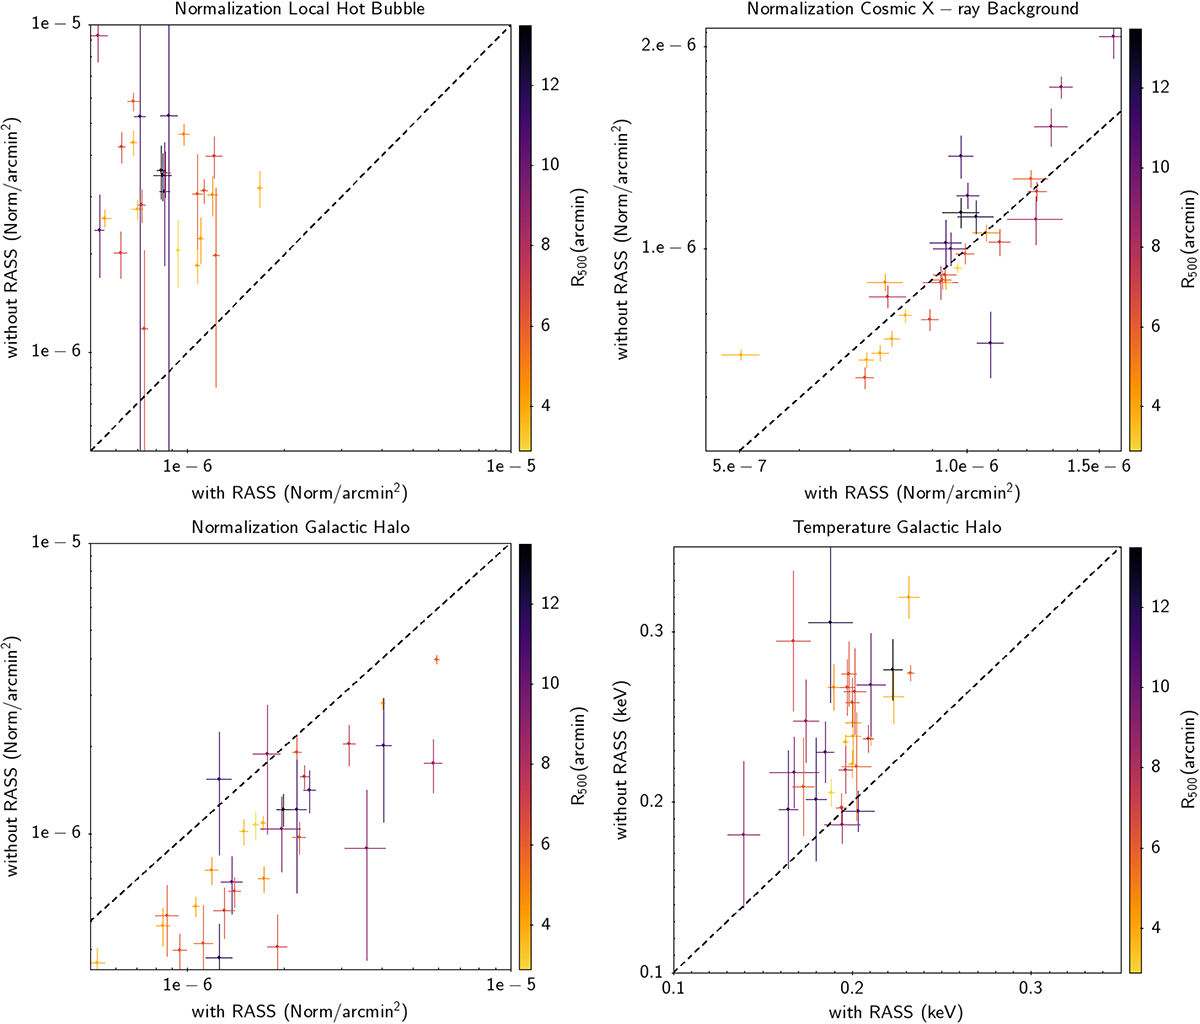
Fig. 4.
Download original image
Comparison of best-fit values for sky background parameters obtained with the RASS joint fit (x-axis) and using XMM-Newton only (y-axis). We show the normalization of the LHB (upper left), and of the CXB (upper right), while in the bottom panels we report the GH normalization (left) and temperature (right). Points are color-coded by the extension of the cluster, estimated by R500, in arcminutes. The dashed line marks the equality line. The LHB and GH components show large systematic variations, reflecting the degeneracies between the components. The CXB normalization shows only a moderate variation on the full sample, with larger difference for extended clusters.
Current usage metrics show cumulative count of Article Views (full-text article views including HTML views, PDF and ePub downloads, according to the available data) and Abstracts Views on Vision4Press platform.
Data correspond to usage on the plateform after 2015. The current usage metrics is available 48-96 hours after online publication and is updated daily on week days.
Initial download of the metrics may take a while.