Fig. C.1.
Download original image
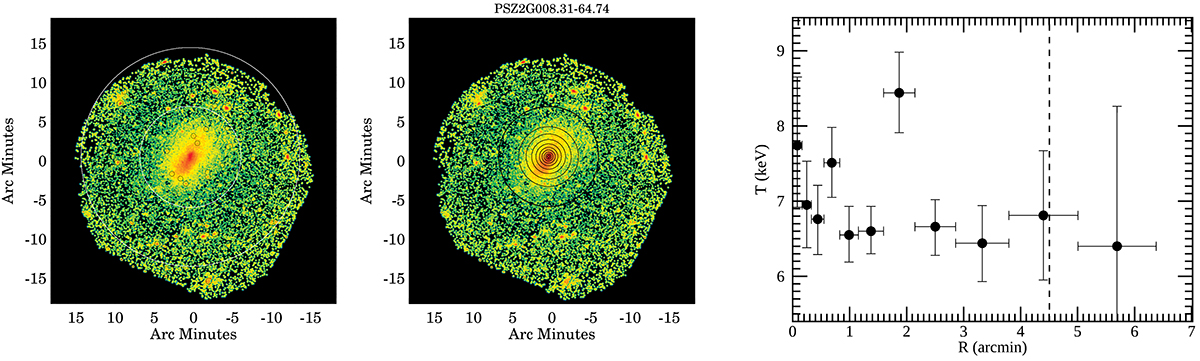
Image and temperature profile of PSZ2G008.31-64.74. The left panel shows the cluster image in the [0.7 − 1.2] keV band, with overlaid masked point sources and the annulus used for estimating the sky background. In the central panel we show the annular regions used for the extraction of the temperature profile, which is represented in the right panel, where the dashed line marks the position of R500.
Current usage metrics show cumulative count of Article Views (full-text article views including HTML views, PDF and ePub downloads, according to the available data) and Abstracts Views on Vision4Press platform.
Data correspond to usage on the plateform after 2015. The current usage metrics is available 48-96 hours after online publication and is updated daily on week days.
Initial download of the metrics may take a while.