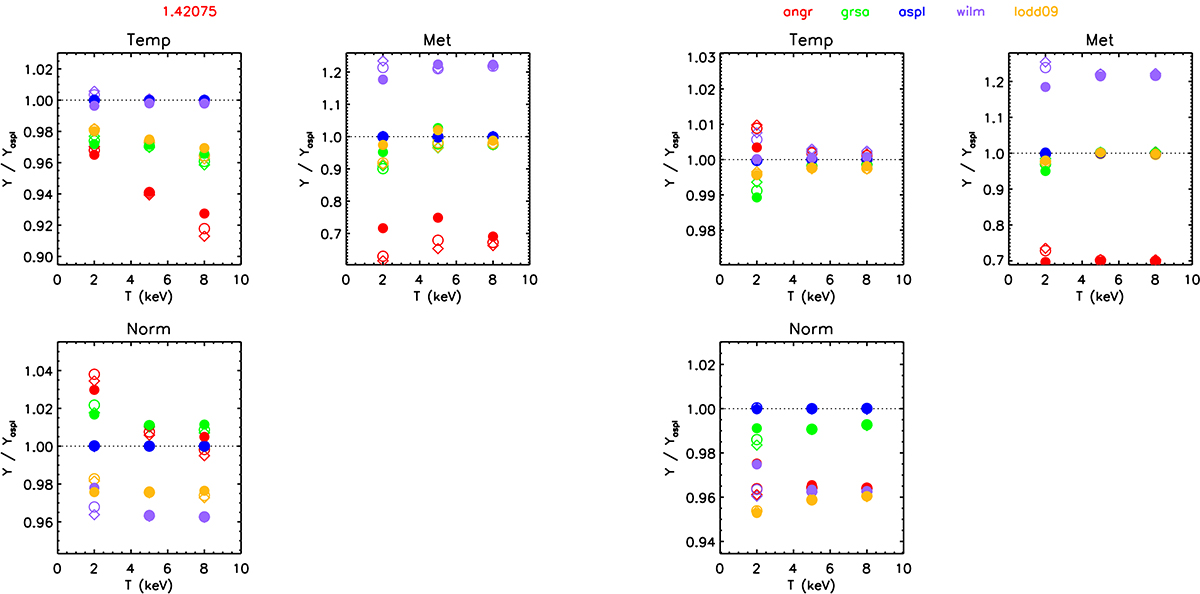
Fig. B.2.
Download original image
Ratios between the best-fit parameters and the input values. Points are color-coded according to the adopted abundance table (aspl: red, lodd09: yellow, aspl: blue, grsa: green, wilm: purple). Different symbols refer to different redshifts (z = 0.05: open diamonds; z = 0.2: open circles; z = 0.6: filled circles). (Left) Assuming NH = 0.05 × 1022 cm−2; (right) with NH = 0.
Current usage metrics show cumulative count of Article Views (full-text article views including HTML views, PDF and ePub downloads, according to the available data) and Abstracts Views on Vision4Press platform.
Data correspond to usage on the plateform after 2015. The current usage metrics is available 48-96 hours after online publication and is updated daily on week days.
Initial download of the metrics may take a while.