Fig. A.2.
Download original image
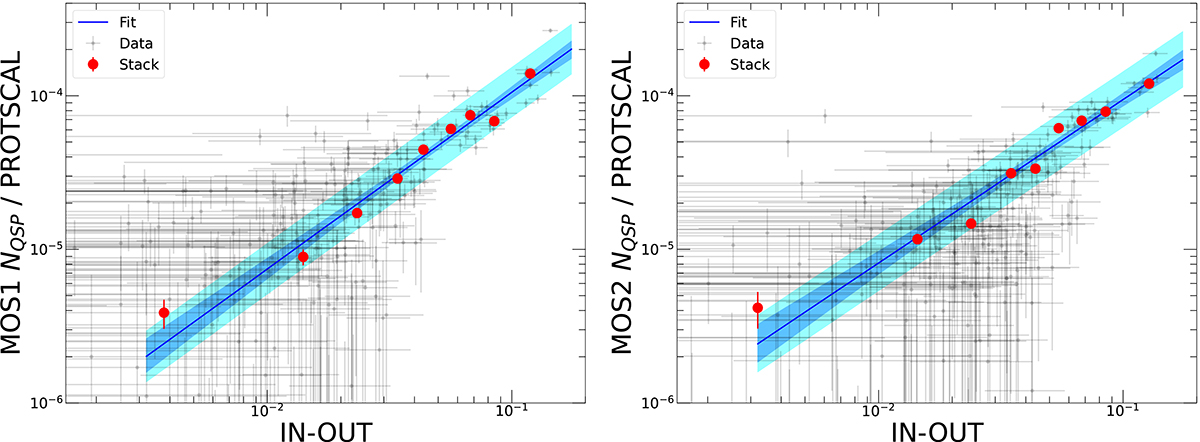
Normalization NQSP of the excess component as a function of inFOV − outFOV for MOS1 (left) and MOS2 (right). The gray points show individual blank-sky observations whereas the red points show the stacked results in bins of inFOV − outFOV. The blue solid line and shaded area show the fit to the data and the 1σ error envelope around the model, whereas the cyan shaded area shows the intrinsic scatter of the relation.
Current usage metrics show cumulative count of Article Views (full-text article views including HTML views, PDF and ePub downloads, according to the available data) and Abstracts Views on Vision4Press platform.
Data correspond to usage on the plateform after 2015. The current usage metrics is available 48-96 hours after online publication and is updated daily on week days.
Initial download of the metrics may take a while.