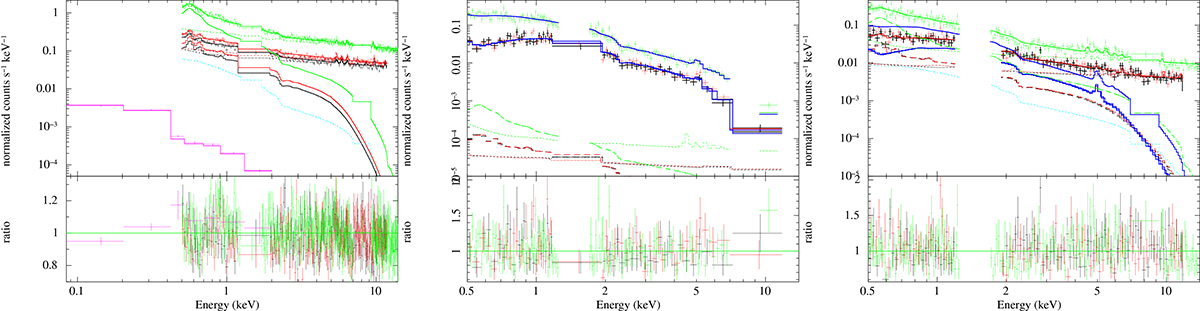
Fig. 2.
Download original image
Examples of our spectral fits for the cluster PSZ2 G349.46−59.95 in different regions: the external region where we fit the sky background (left), a central region dominated by the cluster emission (middle), and an external background-dominated region with SOU/BKG = 0.4 (right). In all panels, the black, red, and green crosses mark the MOS1, MOS2, and pn spectra, while the lines represent the corresponding models. With the same color scheme, the continuous lines mark the total resulting model for each detector, the dotted lines represent the model for particle background, while the dashed lines the sky background. The dotted cyan line (when visible) mark the contribution of the pn OoT events. In the middle and right panel, we highlight in blue the cluster component. In the left panel, magenta crosses represent the data from the RASS spectrum, which is jointly fitted to the EPIC data in our baseline pipeline. In all plots, the bottom panels mark the ratio of the data with respect to the total model.
Current usage metrics show cumulative count of Article Views (full-text article views including HTML views, PDF and ePub downloads, according to the available data) and Abstracts Views on Vision4Press platform.
Data correspond to usage on the plateform after 2015. The current usage metrics is available 48-96 hours after online publication and is updated daily on week days.
Initial download of the metrics may take a while.