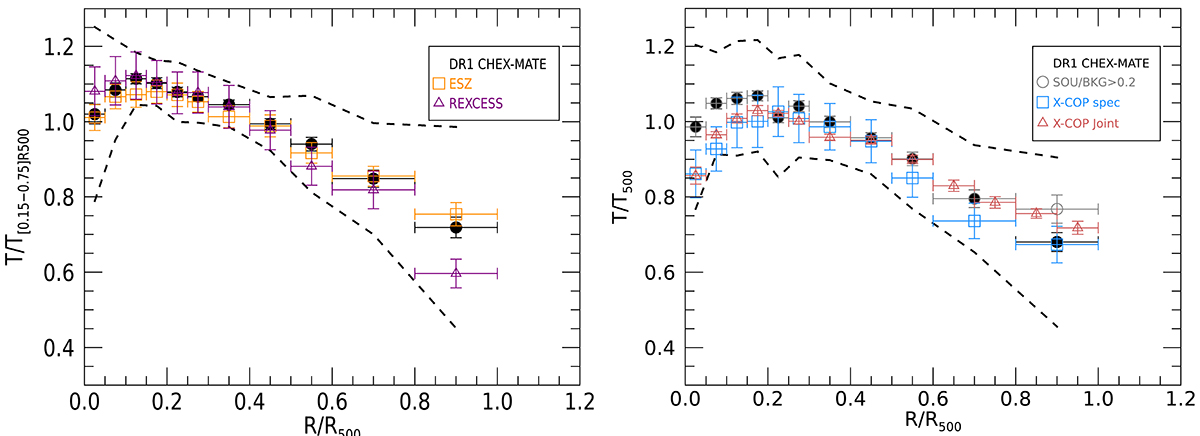
Fig. 18.
Download original image
Comparison of median temperature profiles of the CHEX-MATE DR1 sample (black circles) with other samples studied in the literature. Left panel: comparison with ESZ and REXCESS median profiles, where we have scaled temperature values by the best fit in a region [0.15 − 0.75] R500. Right panel: comparison with X-COP, both the standard results from the X-ray analysis (blue squares) and the joint fit with SZ data (red triangles). The gray empty circles show the DR1 median profile after applying the SOU/BKG > 0.2 selection. Here the temperature scaling T500 is computed from the mass with the expression in Ghirardini et al. (2019), both for X-COP and for CHEX-MATE data. Dashed lines show the total scatter in the DR1 profile.
Current usage metrics show cumulative count of Article Views (full-text article views including HTML views, PDF and ePub downloads, according to the available data) and Abstracts Views on Vision4Press platform.
Data correspond to usage on the plateform after 2015. The current usage metrics is available 48-96 hours after online publication and is updated daily on week days.
Initial download of the metrics may take a while.