Fig. 17.
Download original image
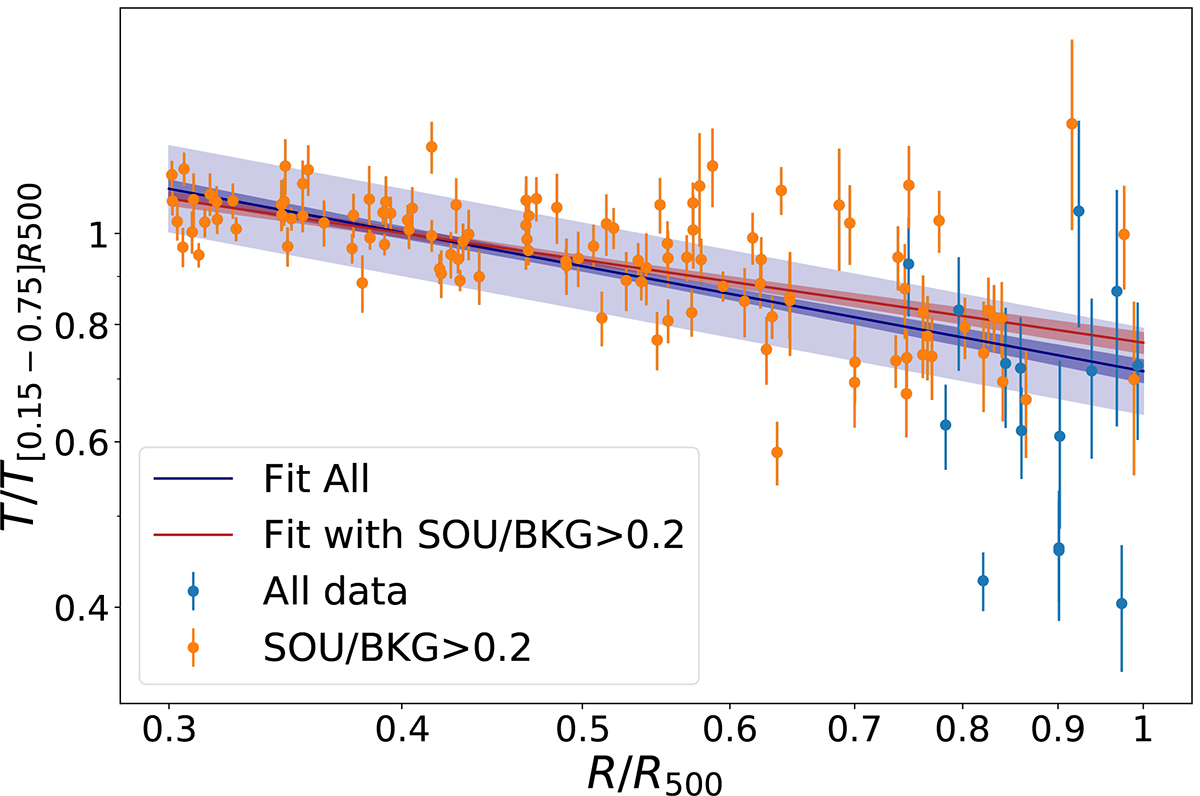
Fit of the temperature profile with a power law for R > 0.3 R500. Orange (blue) points represent regions where SOU/BKG is greater (smaller) than 0.2. The blue line and dark envelope represent the best fit function and its errors on the full dataset, while the light shaded area marks the intrinsic scatter. The red line and envelope show the best-fit for regions with SOU/BKG > 0.2 (intrinsic scatter not shown for clarity).
Current usage metrics show cumulative count of Article Views (full-text article views including HTML views, PDF and ePub downloads, according to the available data) and Abstracts Views on Vision4Press platform.
Data correspond to usage on the plateform after 2015. The current usage metrics is available 48-96 hours after online publication and is updated daily on week days.
Initial download of the metrics may take a while.