Fig. 15.
Download original image
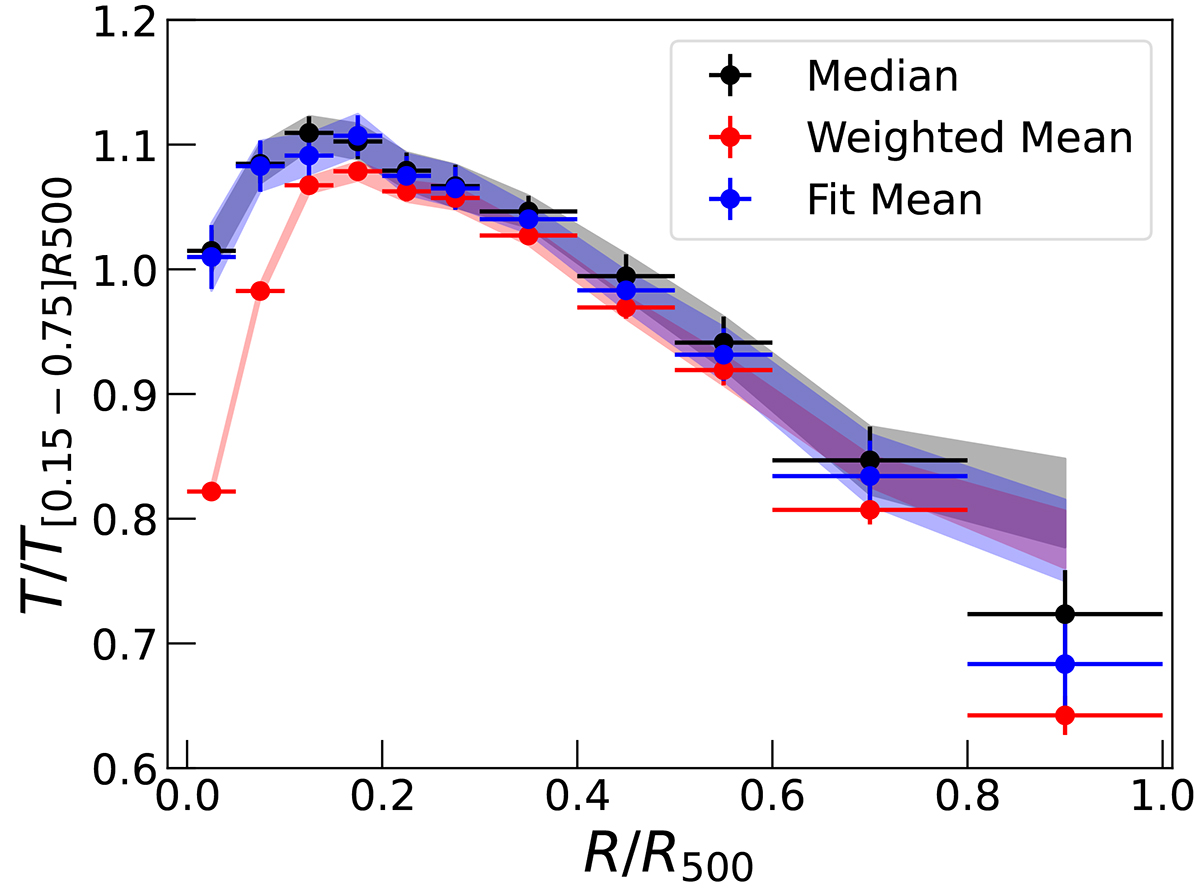
Comparison of the average profiles obtained with different methods: median (black points and gray shaded area), weighted mean (red), and fit mean (blue). Filled points refer to values derived by all measurements, while shaded regions show the values obtained when applying the SOU/BKG > 0.2 selection. Out of the core, the different methods return consistent results after excluding regions with low SOU/BKG, while if we use all measurements the weighted mean always returns lower values than the other methods.
Current usage metrics show cumulative count of Article Views (full-text article views including HTML views, PDF and ePub downloads, according to the available data) and Abstracts Views on Vision4Press platform.
Data correspond to usage on the plateform after 2015. The current usage metrics is available 48-96 hours after online publication and is updated daily on week days.
Initial download of the metrics may take a while.