Open Access
Fig. 14.
Download original image
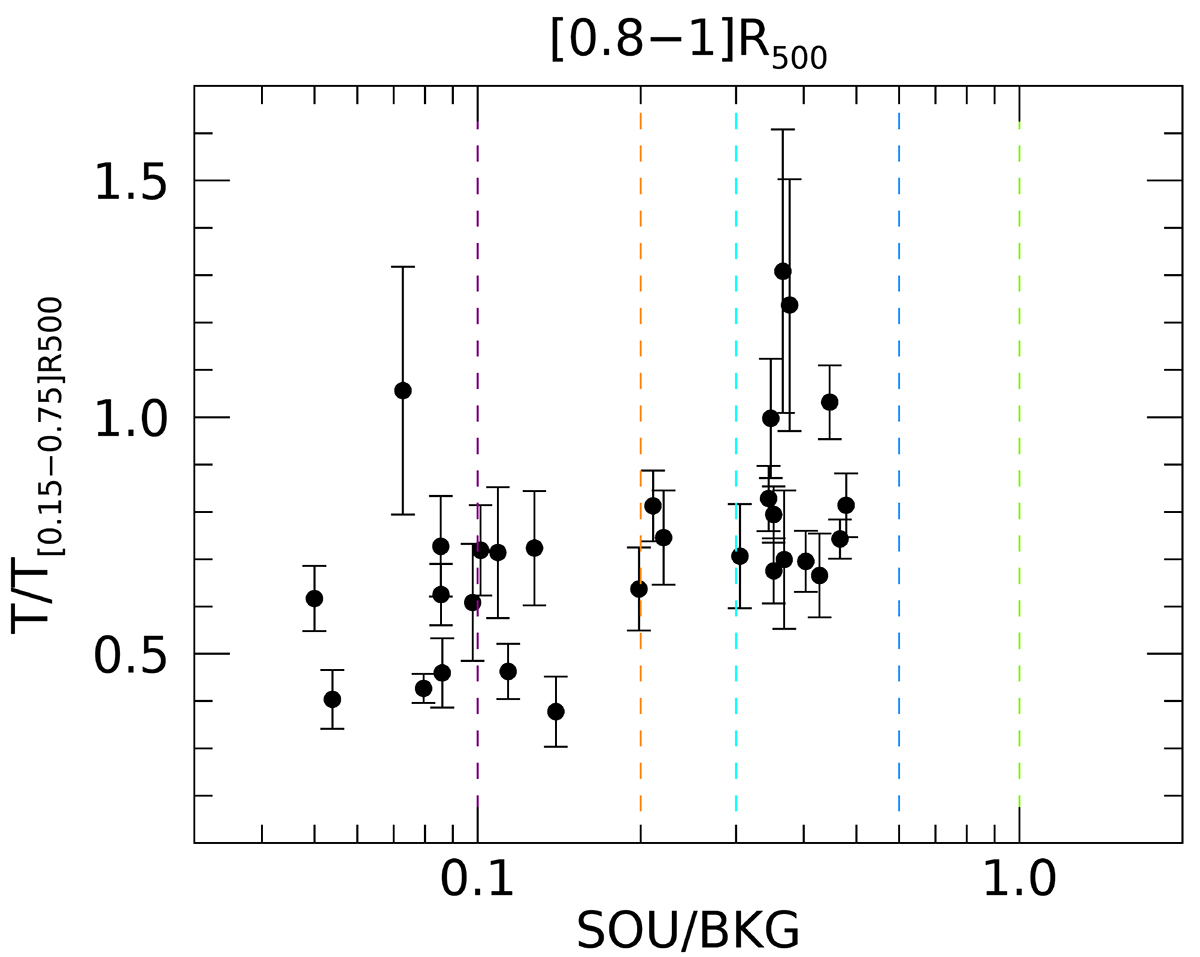
Distributions of the rescaled temperatures as a function of the SOU/BKG in the extraction region for the measurements encompassing 0.9 R500. The vertical dashed lines mark the thresholds used in Fig. 13, with the same color scheme.
Current usage metrics show cumulative count of Article Views (full-text article views including HTML views, PDF and ePub downloads, according to the available data) and Abstracts Views on Vision4Press platform.
Data correspond to usage on the plateform after 2015. The current usage metrics is available 48-96 hours after online publication and is updated daily on week days.
Initial download of the metrics may take a while.