Open Access
Fig. 12.
Download original image
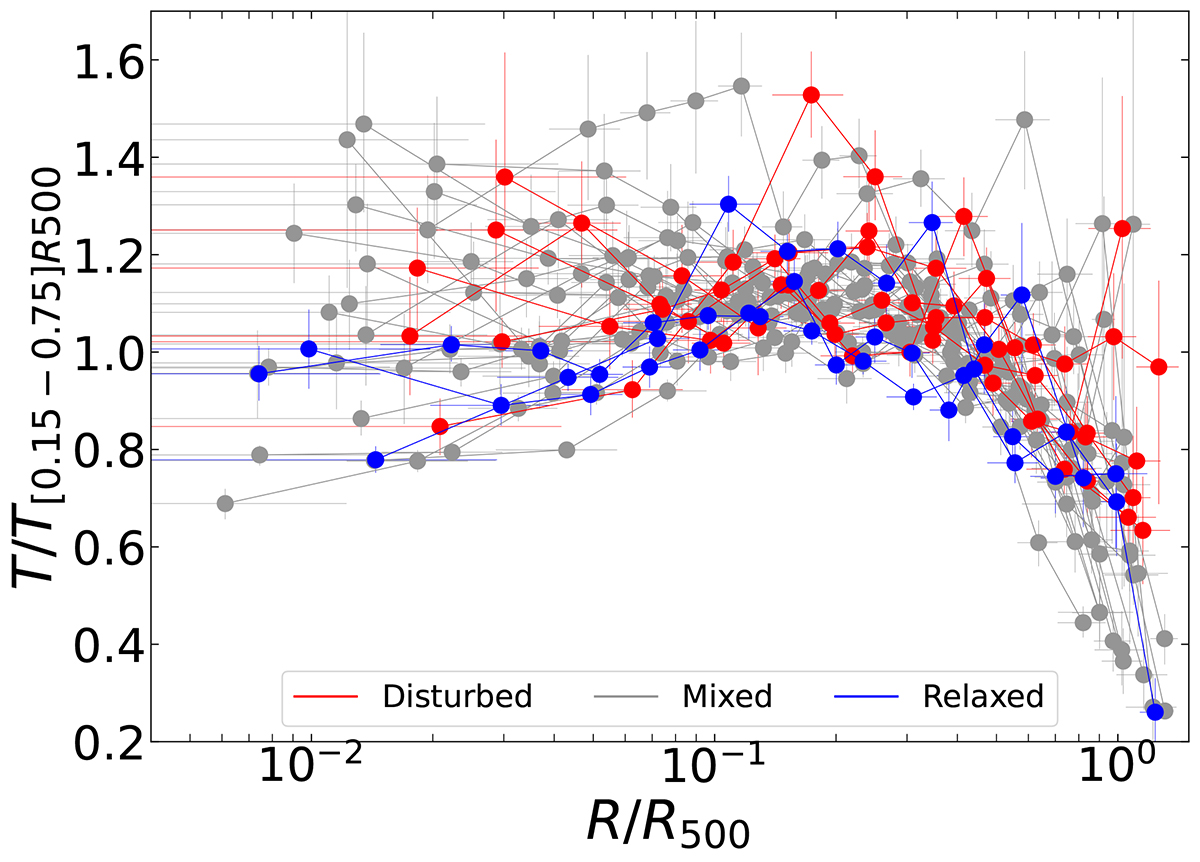
Rescaled temperature profiles of the DR1 sample: clusters belonging to the most relaxed, the most disturbed, and the mixed class are shown in blue, red, and gray, respectively. We use the logarithmic scale on the x-axis to focus on the more central regions.
Current usage metrics show cumulative count of Article Views (full-text article views including HTML views, PDF and ePub downloads, according to the available data) and Abstracts Views on Vision4Press platform.
Data correspond to usage on the plateform after 2015. The current usage metrics is available 48-96 hours after online publication and is updated daily on week days.
Initial download of the metrics may take a while.