Open Access
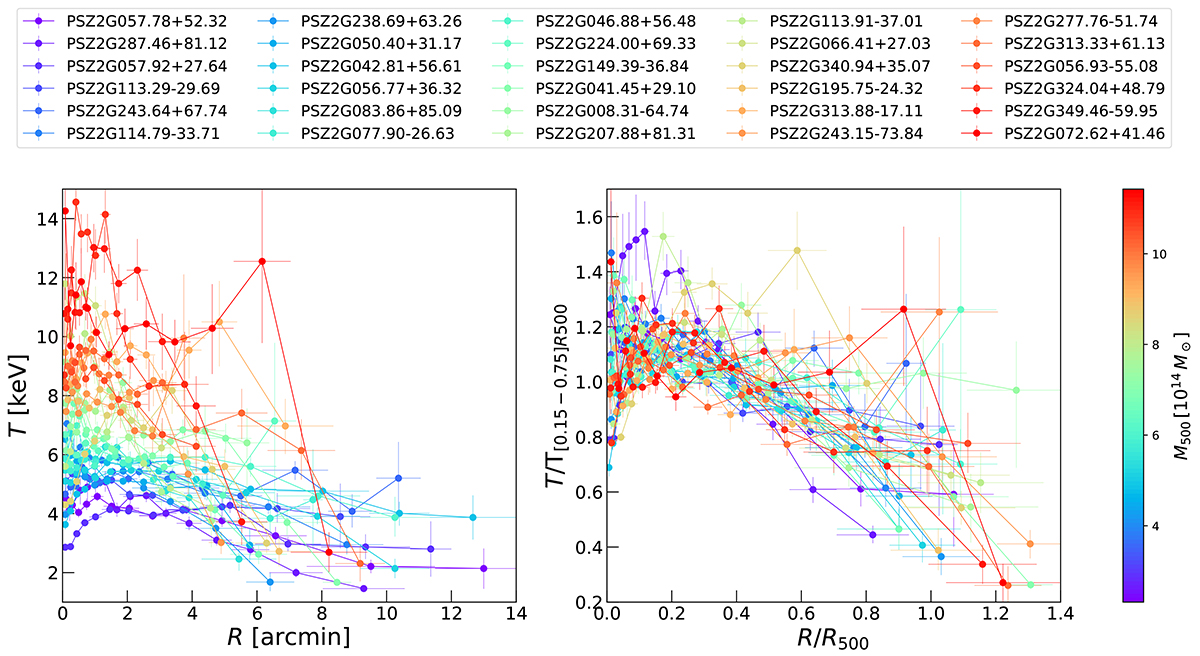
Fig. 11.
Download original image
Individual temperature profiles of the 30 DR1 clusters, color-coded by the total mass. The left panel shows the temperature as a function of the projected position of the annuli in arcminutes, highlighting the large range of measured temperatures and extension of the DR1 sample. The right panel shows the rescaled profiles.
Current usage metrics show cumulative count of Article Views (full-text article views including HTML views, PDF and ePub downloads, according to the available data) and Abstracts Views on Vision4Press platform.
Data correspond to usage on the plateform after 2015. The current usage metrics is available 48-96 hours after online publication and is updated daily on week days.
Initial download of the metrics may take a while.