Open Access
Fig. 10.
Download original image
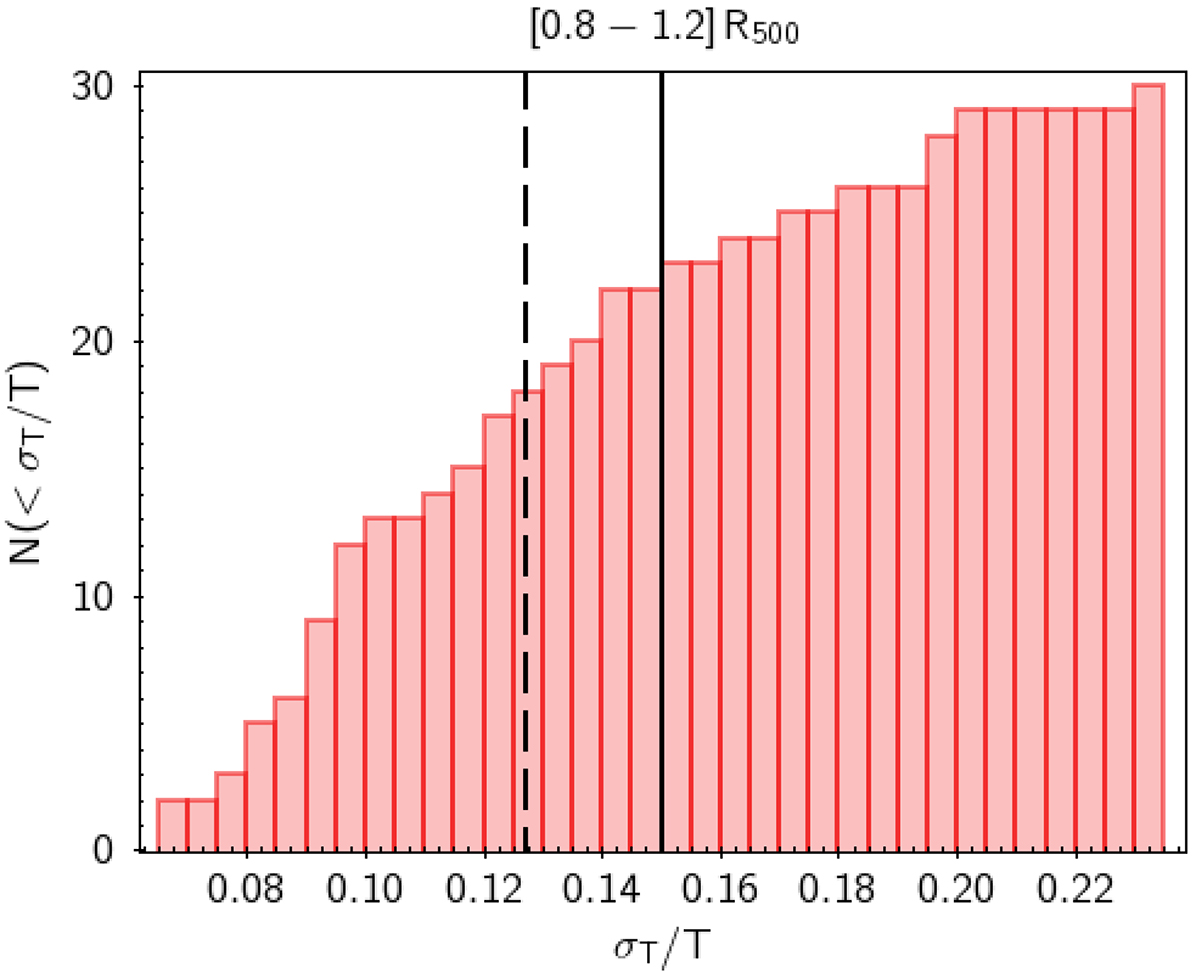
Cumulative distribution of clusters where the temperature measurement in the [0.8 − 1.2] R500 bin reaches a nominal error as a function of the relative statistical error σT/T. The black continuous line shows the goal in the CHEX-MATE feasibility (15%), while the dashed line shows the median value on the sample (12.7%).
Current usage metrics show cumulative count of Article Views (full-text article views including HTML views, PDF and ePub downloads, according to the available data) and Abstracts Views on Vision4Press platform.
Data correspond to usage on the plateform after 2015. The current usage metrics is available 48-96 hours after online publication and is updated daily on week days.
Initial download of the metrics may take a while.