Open Access
Fig. 9.
Download original image
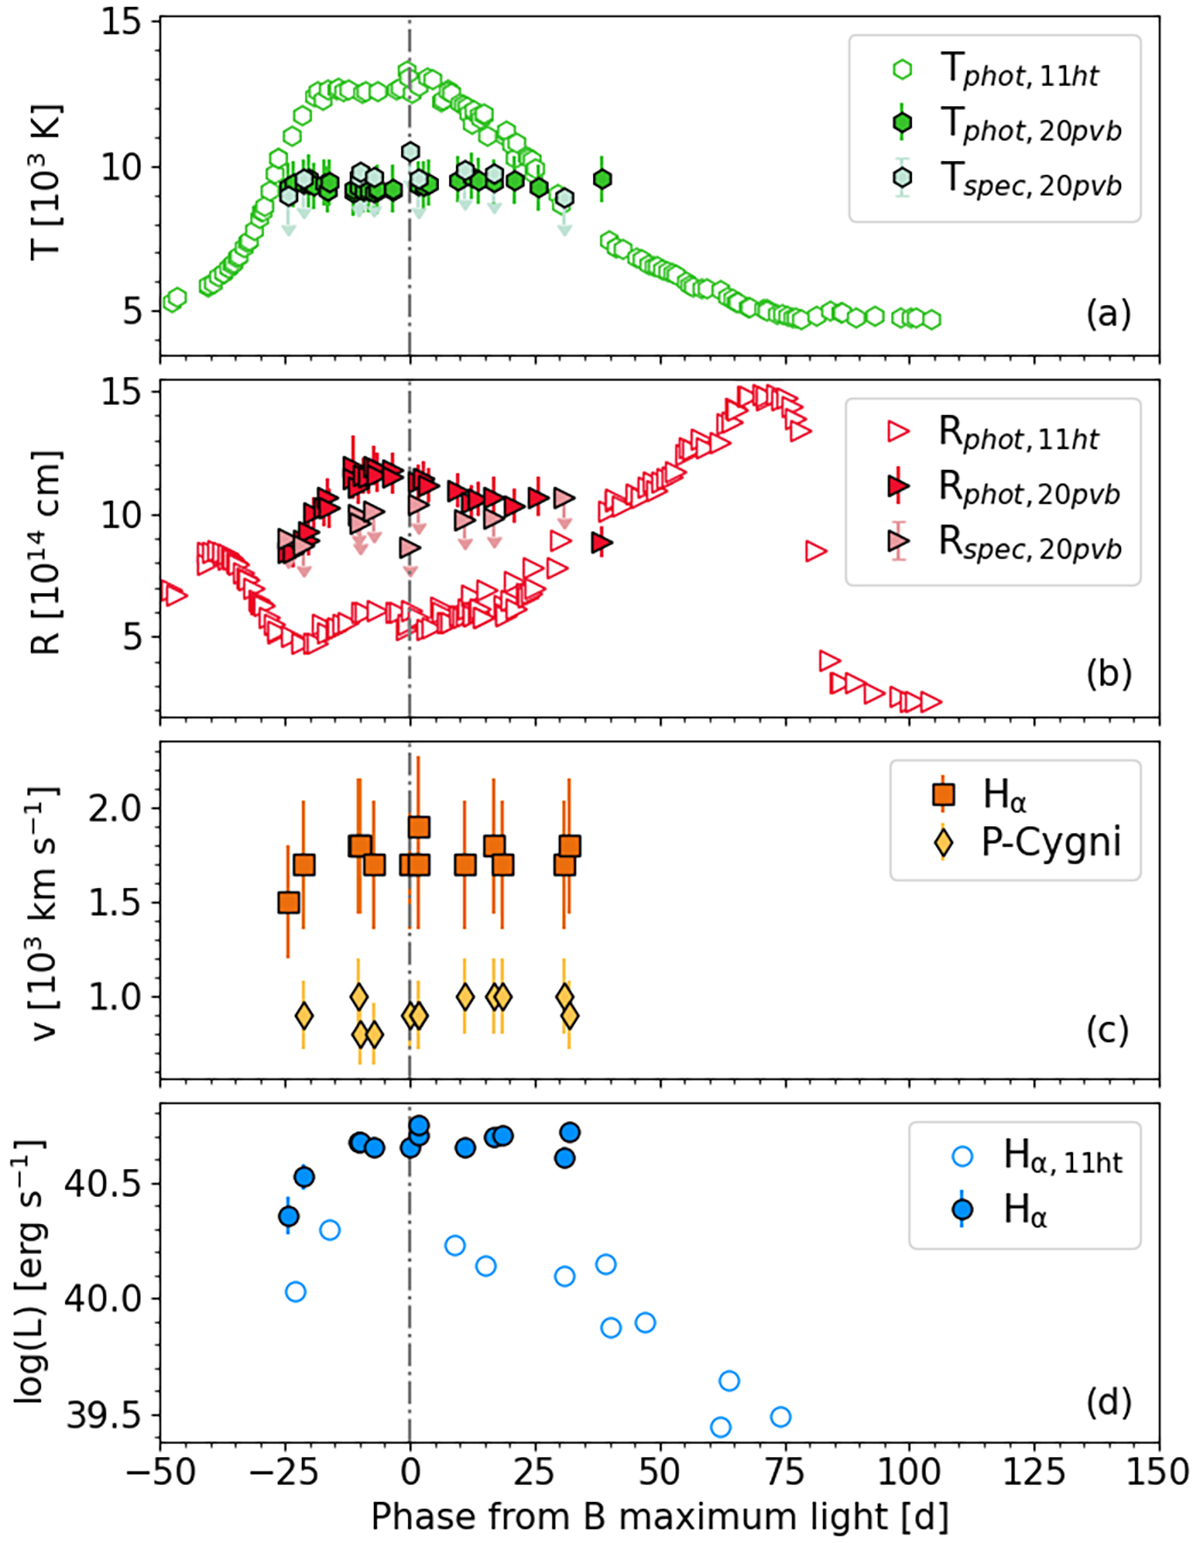
Evolution of the best-fit blackbody temperatures (a), photospheric radius (b), FWHM and blueshift evolution for the whole profile and P Cygni Hα emission (c), and evolution of the total luminosity of Hα (d) of SN 2020pvb and SN 2011ht. The dot-dashed vertical line indicates the B-band maximum light of SN 2020pvb.
Current usage metrics show cumulative count of Article Views (full-text article views including HTML views, PDF and ePub downloads, according to the available data) and Abstracts Views on Vision4Press platform.
Data correspond to usage on the plateform after 2015. The current usage metrics is available 48-96 hours after online publication and is updated daily on week days.
Initial download of the metrics may take a while.