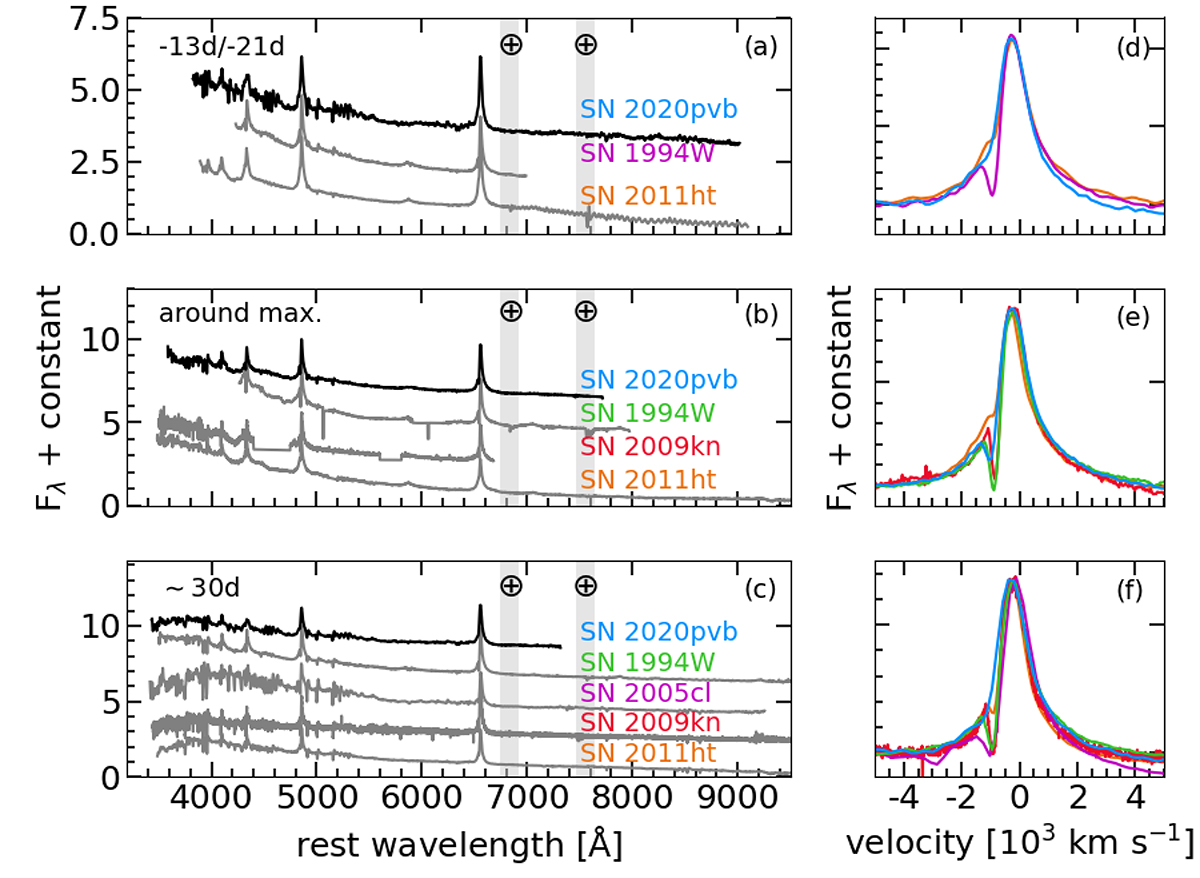
Fig. 8.
Download original image
Comparison of SN 2020pvb spectra before (a), around (b), and after (c) the maximum peak. We also include those of SNe 1994W, 2005cl, 2009kn, and 2011ht at similar epochs. The Hα profiles are enlarged on the right of each panel and shifted to the peak ((d), (e), and (f)). The Hα profiles of each SN match the colours of their label on the left. All spectra have been corrected for their host-galaxy recessional velocities and extinctions (values adopted from the literature).
Current usage metrics show cumulative count of Article Views (full-text article views including HTML views, PDF and ePub downloads, according to the available data) and Abstracts Views on Vision4Press platform.
Data correspond to usage on the plateform after 2015. The current usage metrics is available 48-96 hours after online publication and is updated daily on week days.
Initial download of the metrics may take a while.