Open Access
Fig. 7.
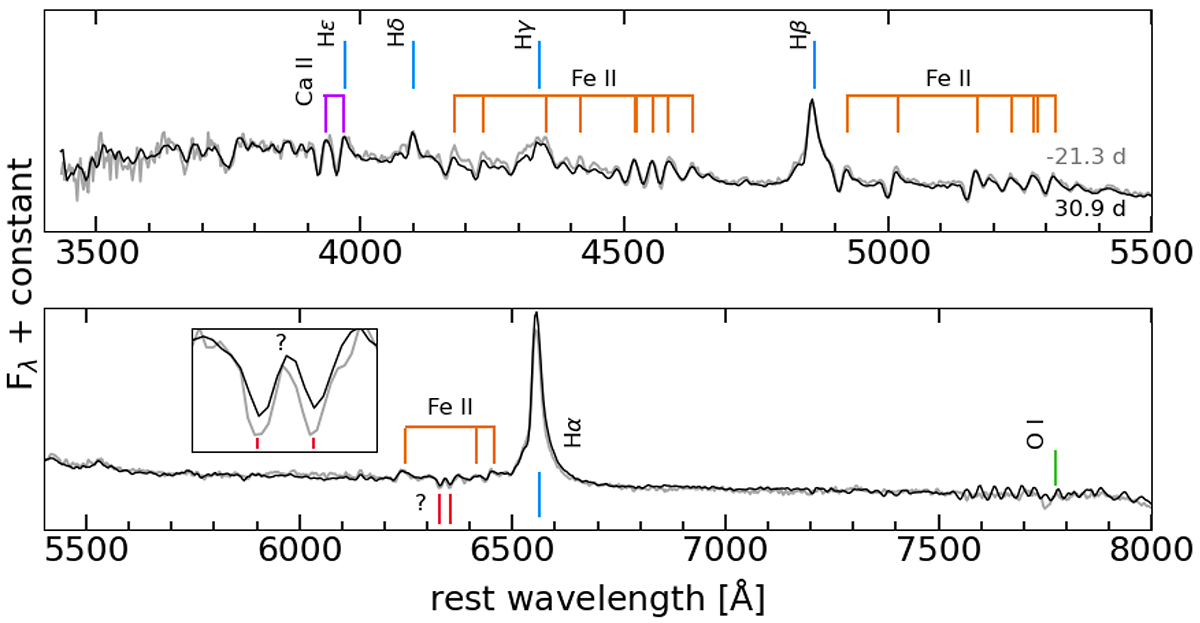
Download original image
Superposition of the 2020 October 15.88 UTC (–21.3 d, solid grey line) and 2020 December 08.03 UTC (31.9 d, dotted black line) spectra of SN 2020pvb. The insert is a zoomed-in view of the absorptions between 6300 and 6400 Å. The most prominent spectral features are indicated.
Current usage metrics show cumulative count of Article Views (full-text article views including HTML views, PDF and ePub downloads, according to the available data) and Abstracts Views on Vision4Press platform.
Data correspond to usage on the plateform after 2015. The current usage metrics is available 48-96 hours after online publication and is updated daily on week days.
Initial download of the metrics may take a while.