Open Access
Fig. 6.
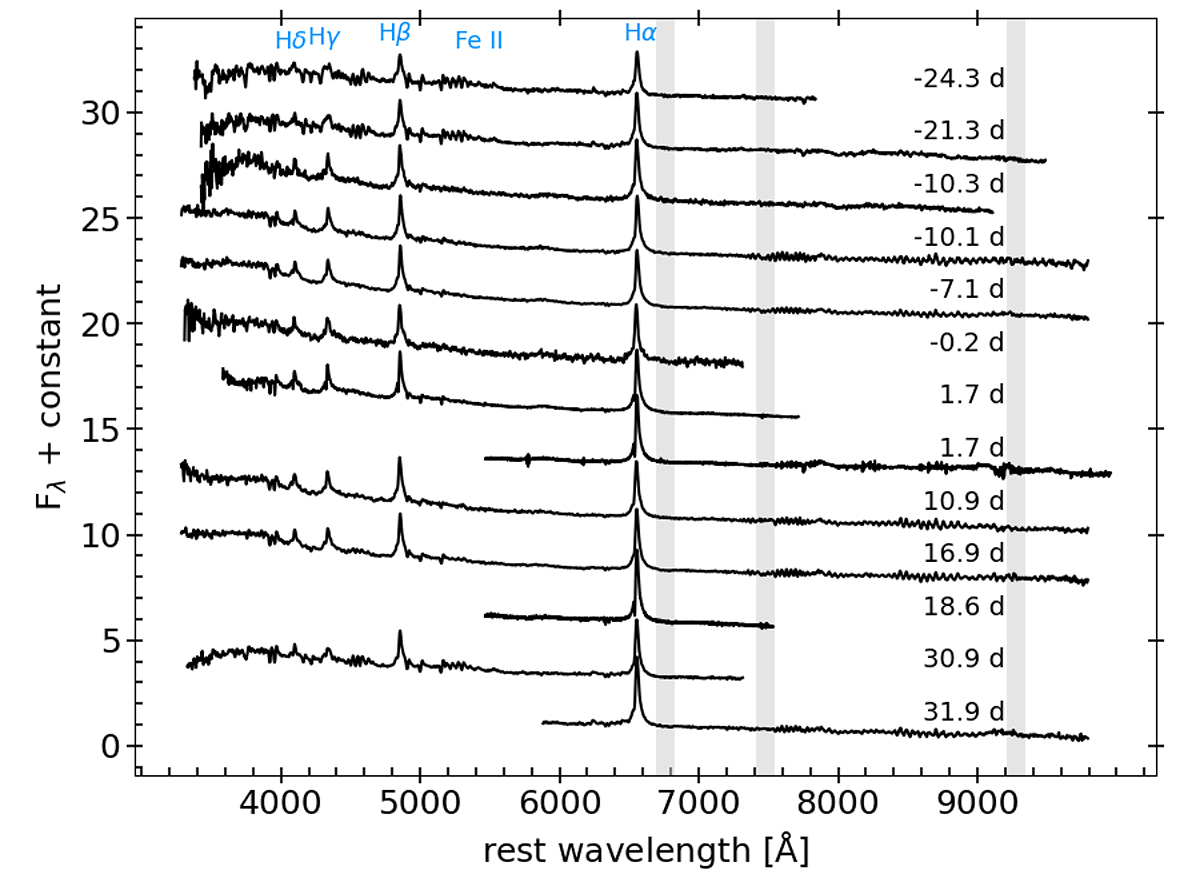
Download original image
Spectral sequence of SN 2020pvb extending from –24.3 d to 31.9 d from maximum light. All spectra have been corrected by redshift. The shaded wavelength regions indicate areas of strong telluric absorption, which has been removed when possible. The locations of the most prominent spectral features are also indicated.
Current usage metrics show cumulative count of Article Views (full-text article views including HTML views, PDF and ePub downloads, according to the available data) and Abstracts Views on Vision4Press platform.
Data correspond to usage on the plateform after 2015. The current usage metrics is available 48-96 hours after online publication and is updated daily on week days.
Initial download of the metrics may take a while.