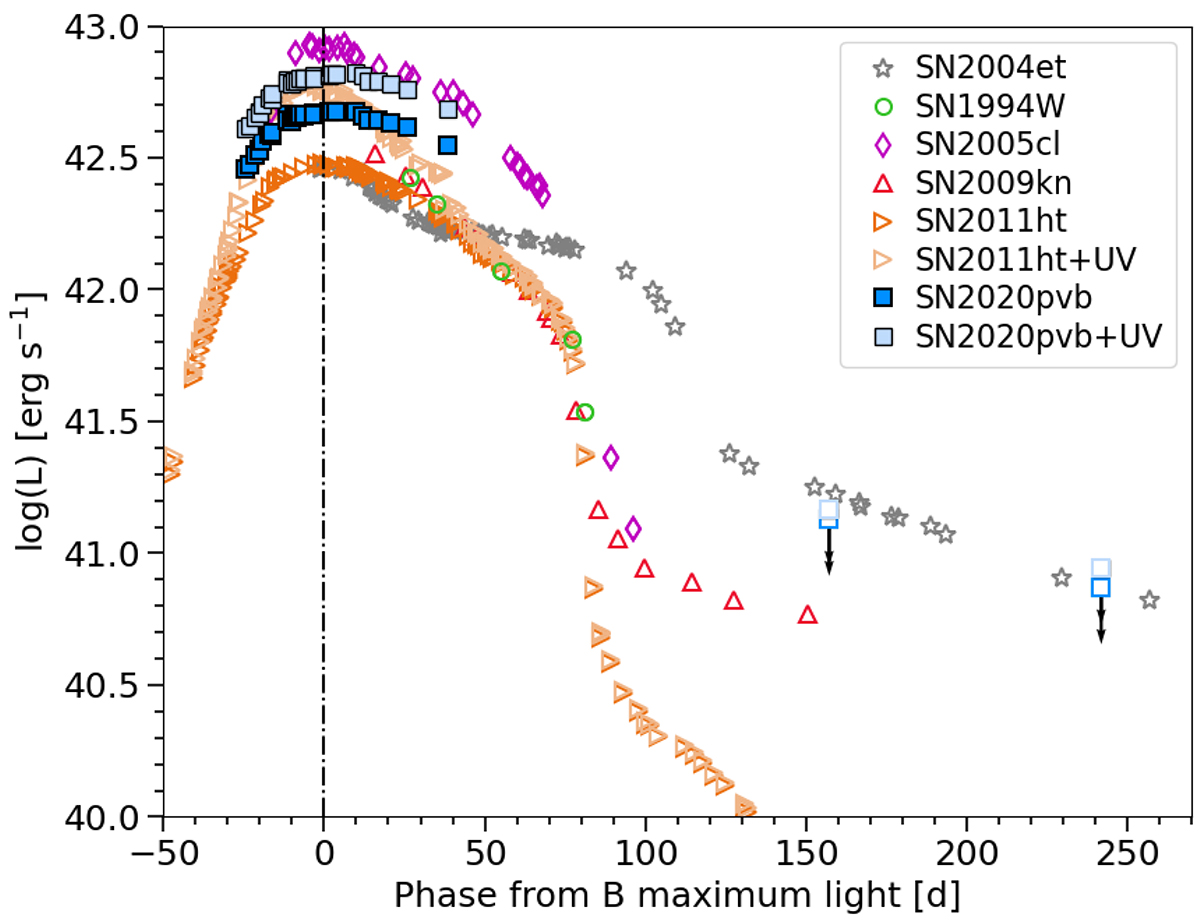
Fig. 5.
Download original image
Pseudo-bolometric light curve of SN 2020pvb obtained by integrating optical and NIR bands, compared with those of SNe 1994W, 2005cl, 2009kn, 2011ht, and the Type IIP SN 2004et. The UV-optical-NIR pseudo-bolometric light curve of SN 2020pvb is also included. The dot-dashed vertical line indicates the B-band maximum light of SN 2020pvb.
Current usage metrics show cumulative count of Article Views (full-text article views including HTML views, PDF and ePub downloads, according to the available data) and Abstracts Views on Vision4Press platform.
Data correspond to usage on the plateform after 2015. The current usage metrics is available 48-96 hours after online publication and is updated daily on week days.
Initial download of the metrics may take a while.